Custom date comparison
The year started with the addition of the ability to use custom comparison dates. Since launch there has been no true way of displaying month on month. For many businesses this isn’t how they report and can lead to confusion when comparing data from Data Studio with Google Analytics.
With Custom Date Comparison there is now the option to compare with specific time frames. The only downside is MoM can’t be achieved without manually changing the comparison range each month.
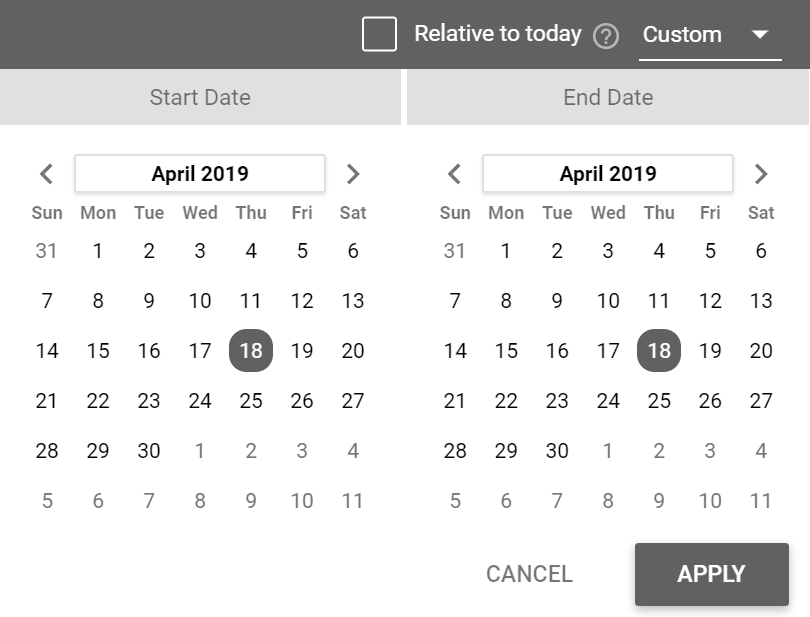
Hopefully we will soon see Advanced Date Ranges for comparison to allow for true month-on-month reporting rather than period on period.
Custom date ranges
It’s finally here – One of the most time-saving features for me since the release of Data Studio! Before the release of Advanced Date Ranges, it was impossible to do automated dashboards if you weren’t using default date ranges such as last week, last month etc. If you wanted to have a graph for the last 12 months, you’d have to go in to Data Studio each month to update the dates.
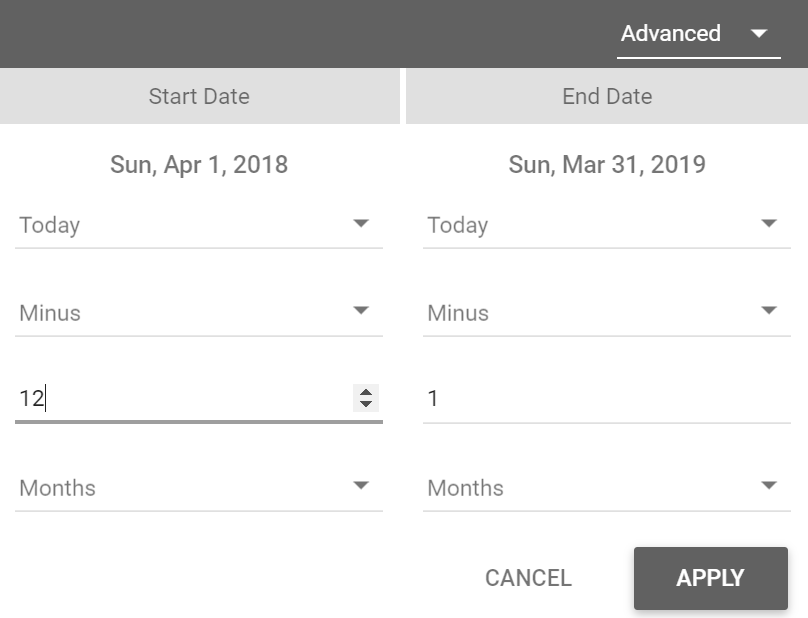
Bring in Advanced Date Ranges! You’re now able to have any rolling date, with the ability to use minus or plus X days, weeks, months, quarter or year from the current date.
There is also the option to pick a date rather than using today, giving the ability to have graphs start when a view was created and rolling on for eternity!
PDF download refinements/schedule email delivery of reports
January 31, 2019 / March 7, 2019
What is it?
Following on from my last round-up, Data Studio has updated the ability to include viewer refinements made to the report when downloading. This means that users can now control the date range, filters, table pagination and data control settings. These changes now make PDF download a really useful feature for sending reports to stakeholders without messy workarounds.
On top of this, we now also have email scheduling. This makes Data Studio not only a great dashboarding tool but could be used to replace internal reporting.
Version history
What is it?
Version History is available on most Google products and is a welcome feature in Data Studio. Just as with other products, version history lets you go back through all changes made to the Data Studio with timestamps and editor names. You also have the ability to restore any of these versions.
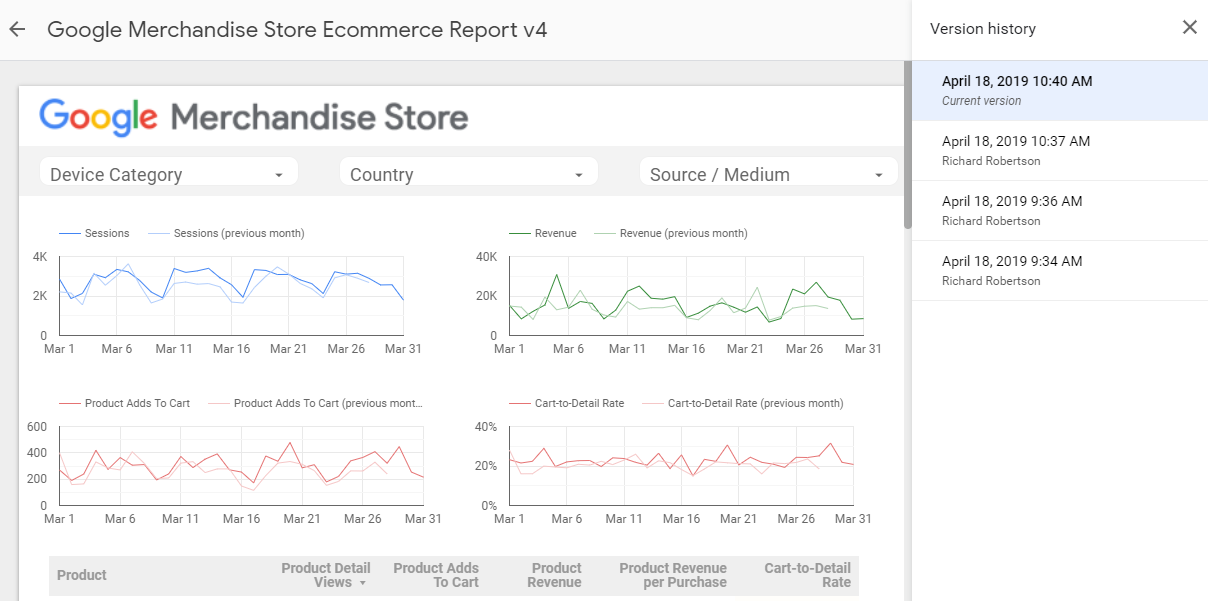
This feature is very helpful if you have multiple editors on a Data Studio, allowing you to look back at changes that have been made and restore previous versions if needed. The only downside is the versions can only be seen from the launch date, with any changes made before that unavailable.
Smaller updates
There have also been some smaller updates made this quarter that deserve mentioning:
- Customise canvas size per page – No longer does your entire dashboard have to use the same templates with the ability to now change the canvas size for individual pages
- Improved Table Formatting – You can now right click on tables to automatically resize the columns to fit the data within
The Data Studio product team has once again delivered a quarter full of useful features and I can’t wait to see what the next quarter brings. There are exciting features already being teased by the GCP team including data control, which will allow for one master template that can be shared with multiple clients that only displays their data. Hopefully these new features will benefit you as much as they have us and if you get stuck, speak to the experts.

Anu Shukla
Great stuff!
Love your writing skills,
keep sharing things like this.
Richard Robertson
Thanks Anu! Glad you enjoyed it
jimmy
that,s great to see some amazing features here. Thanks for writing such informative blog.