GTM’s JavaScript Error trigger type

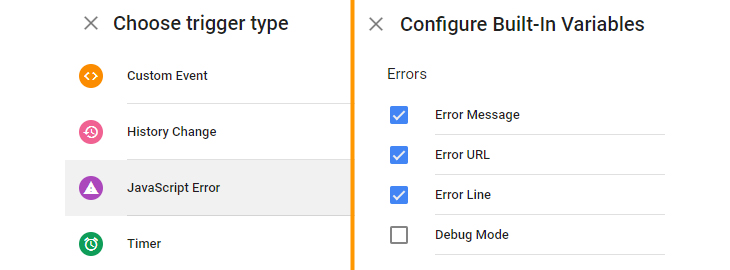
What makes all this possible is GTM’s JavaScript Error trigger type. This wonderfully simple feature allows you to fire a tag (such as a GA event) whenever the browser encounters an uncaught JavaScript error. In other words, do X when something breaks.
Combined with the “Error Message”, “Error URL”, and “Error Line” built-in variables, we can dispatch valuable information about the nature of the error to GA, allowing us to analyse the real-world occurrence of these issues at scale.
In the following example, I have chosen to create an entirely new event category: “JS Error”. The action and label are set as the error message, then the error line and URL together. The non-interaction hit flag is set to True, ensuring that this won’t affect the bounce rate calculation in otherwise single hit sessions. For now, I’ve not customised my trigger: it will simply fire on all uncaught JavaScript errors.
The result of this setup is that valuable data, which would typically only be seen by your developers in their browser console, is instead sent to GA where it can be reviewed. In the example below, the Uncaught TypeError message would be sent to GA as an event. It can then be cross-referenced with GA’s built-in dimensions like Browser, Operating System, and Page, allowing us to determine exactly where the problem lies.

You could easily stop here; once you’ve published these changes to your GTM container, data will start accumulating in GA where it can be reviewed with all your other events. However, by funneling these events into a Data Studio dashboard, you’ll be ensuring that this data is easily accessible at a single URL for your development team.
Click here to access the report template. Simply make a copy of this report and set the data source to your own GA property. Note that the preset filter on every chart will exclude all events except those with a category of ‘JS Error’ – make sure that this matches whatever naming you’ve settled on in GTM.
Pay attention to the two filter drop-downs below the main time series chart. Combined with the date picker in the top right, these allow you to narrow down your data to show only a specific subset of errors.
By default, the table below the filters will show the most frequently occurring error messages for your chosen date range and filter settings. If you wish to instead see the most frequently occurring script URLs or page URLs, simply change the primary dimension for this table to ‘Event Label’ or ‘Page’ instead of ‘Event Action’.
Finally, note the charts on the right, under Device Type, Operating System, and Browser: by filtering to a single error message or URL, your development team will be granted actionable insight into the exact incompatibility.

In my opinion, there aren’t many reasons not to implement this kind of tracking – assuming for a moment that your site is both large and imperfect, errors of this kind are almost certainly happening right now. All you’re doing by implementing this tag is ensuring that your development team is aware of them. A couple of caveats and gotchas below…
- If your site is particularly buggy, it’s possible that this technique will hugely increase the number of events being fired to your GA property. Remembering the 10 million monthly hit limit on free GA, you might want to scale back the volume of events being fired by initially enabling this tag only on your development environment, or by sampling events using the random number variable.
- If you see a large number of errors which report simply ‘Script error’, this will be the result of scripts served from a different origin. Supplemental data such as the error message and line number aren’t exposed, so GTM cannot fire them to GA. You can read more about these kinds of errors here on the Sentry blog.
Finally, credit where credit is due! My eyes were first opened to the possibilities of GTM’s error trigger by Grant Kemp in his Measurefest presentation, How to Perform Google Analytics Magic. I’ve simply extended his technique and routed the data into a convenient front-end using Data Studio.
Thanks for reading. If you have any questions or suggestions, please do let me know in the comments below or on Twitter.

Tristan Bailey
Nice post Tom, I was previously only tacking Event from JS and not also the line number and source, so should make things a little clearer in the logs.
Mainly see gtm errors for things not loading from 3rd parties so harder to track through, but should mean site JS is working nicely.
Valentin
Thanks for the wonderful post very useful guide helped me a lot.
Miroslav Ficza
Hello,
Useful stuff. :)
I additionaly add: URL | FIle | Error line into the Event Label.
it’s could be useful in a report especially for a dev team.
Thanks