Dimensions and Metrics
First things first, we need to remind ourselves of the difference between dimensions and metrics.
A conveniently alliterative way to remember the difference is to think of dimensions as describing data and metrics measuring data. In the data table below, the primary dimension is marked in blue, and the associated metrics are in pink.
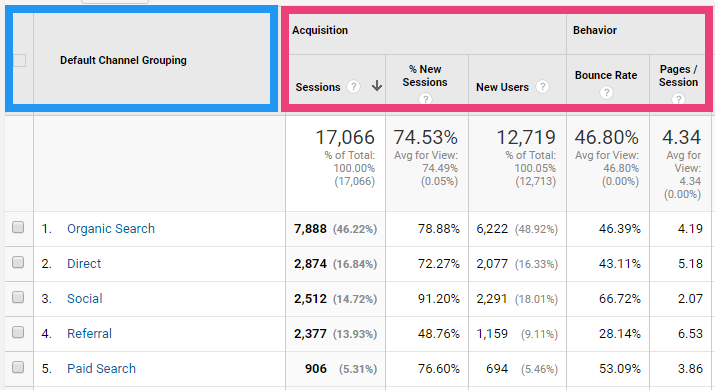
Dimensions are the ‘what’: they describe what keyword did the visitor used, which page they landed on, what country they’re from, and so on. Metrics, on the other hand, are the measurements which let us quantify our data: how many pages were viewed, how long a user stayed on the site, and so on.
The Four Levels of Scope
Each dimension and metric has a scope. These are:
- Hit: The most granular level of data. Their scope is limited to themselves. An example of a hit-scoped dimension is Page, which obviously changes for each pageview hit. This ladders up to…
- Session: As you know, GA groups hits into sessions. Dimensions and metrics with a session-level scope describe attributes of these browsing sessions. An example would be the traffic Source/Medium; this is set once per session.
- User: The highest level of data. These dimensions and metrics relate to users, although it would more accurate to describe them relating to cookies! More on that later. An example would be the User Type dimension, which exposes whether a user is new or returning.
- Product: Dimensions and metrics with a product-level scope are used for ecommerce reporting. An example would be Product name or Product price.
A Practical Example
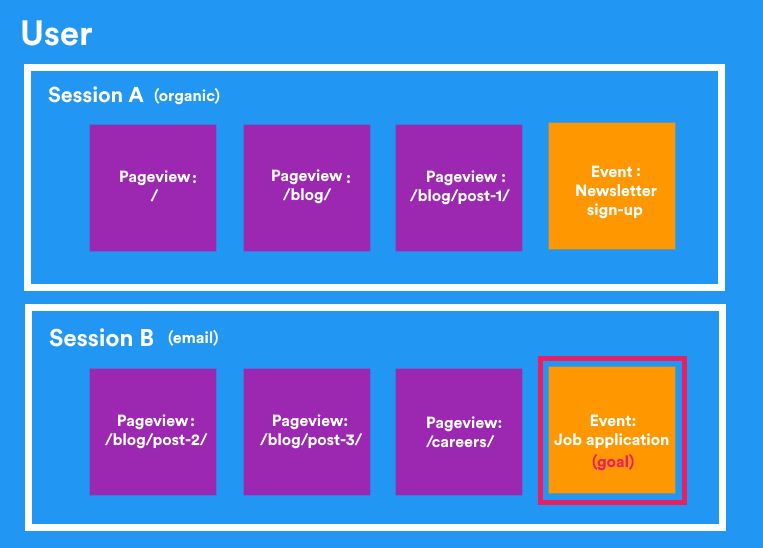
To help us understand the impact of scope on our reports, let’s take an example of a single user on builtvisible.com.
This user visited our site twice. They discovered our website via a search engine, browsed the blog, then signed up to our newsletter. They later came back via email for a second session, reading a few more blog posts before heading to our careers page and converting by sending in a job application.
Review the visualisation below, and as you do so, think about the scope of the following dimensions & metrics: Landing Page, Hostname, Medium, and Event Value:
Side Note: For a refresher on what starts and ends sessions, head over to my beginners guide. And if you really want to dive into the intricacies and edge cases around session logic, have a read of Simo’s great article on the schema conspiracy.
First of all, how is our second session recognised as coming from the same user? For this to happen (without User ID being enabled), our user has to return using the same browser with the _ga cookie still present in browser storage and within the cookie expiration window. This means the client ID can be used to identify these sessions as having come from the same user. These 8 pageview hits will therefore increment the Users metric by 1, while the number of Sessions is reported as 2.
Let’s now look at the dimensions and metrics we decided to explore earlier, and identify where and how they’re set in the example above.
- Landing Page – Session-level scope. This would be set as twice, as the homepage for session A, and
/blog/post-2/for session B. - Hostname – Hit-level scope. It might be identical for every hit in this case (i.e. builtvisible.com), but think about cross-domain tracking setups: it has to be set for each hit, be that retailer.com or paypal.com.
- Medium – Session-level scope. This would be set as ‘organic’ for session A, and ‘email’ for session B (assuming we have our UTM parameters configured correctly!)
- Event Value – Hit-level scope. While goals are calculated at the session level (which is why each goal can only convert once per session), events can fire an unlimited number of times. Each event hit has 4 attributes (category, action, label, value) which are restricted to hit-level scope. This means we could set the event value of the newsletter sign-up to (say) 5, but the job application to 50.
Reporting
Returning to our previous example, it will hopefully now be clear why the Channels report includes that specific combination of dimensions and metrics.
The Default Channel Grouping (which is discerned from source/medium) is a session-scoped dimension; it’s possible for one user to return via several different channels, but the hits within a particular session are grouped since they’ve come from a single channel. This is why the report’s metrics include sessions, pages/session and bounce rate (i.e. the percentage of single-hit sessions), rather than hit-scoped metrics like pageviews and time on page.
But what about Custom Reports? Do the same restrictions still apply?
Well, yes and no – you’re actually given a lot of freedom to pair up dimensions and metrics of different scopes, but the results can often be confusing or misleading. The resulting report might not mean what you think it means. If you pair up the hit-scoped dimension Page with the Sessions metric, for example, you’ll actually get the number of sessions which started on each page (i.e. the number of times each page served as a landing page), not the number of sessions in which a page was viewed at any point (for this you’ll want unique pageviews). More on the intricacies of this scenario is available on Google Support.
So in summary, always ask yourself: do the combination of dimensions and metrics I’m using make sense in light of their scopes?
Custom Dimensions and Metrics
Choosing an appropriate scope is obviously critical when you start creating your own dimensions and metrics.
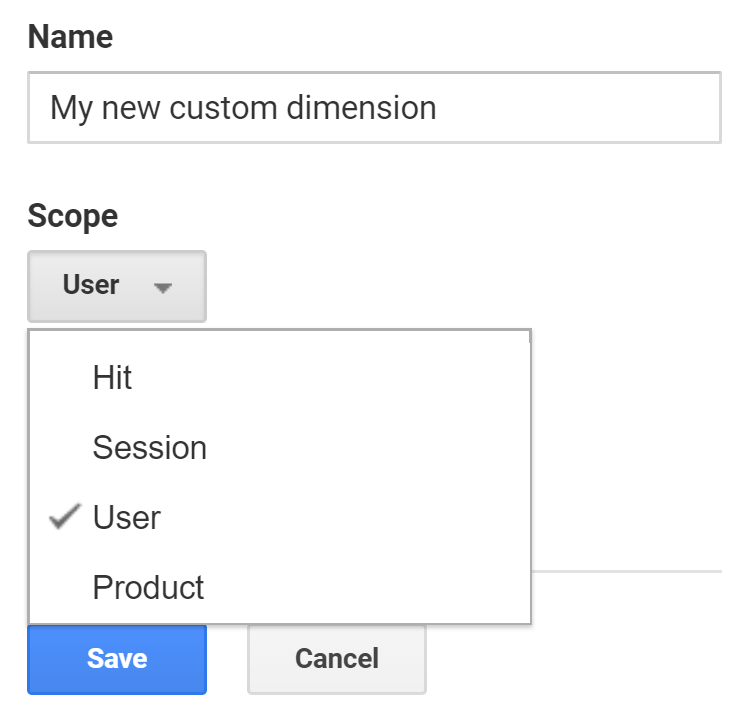
If you’re interested in analysing sessions on your website based on whether the user was signed-in or signed-out, for example, you would need to give your dimensions a session scope. I’ve written a complete guide to custom dimensions over on Moz. Note that to create product-scoped custom dimensions, you’ll need to be using Enhanced Ecommerce rather than the standard Ecommerce plugin.
You can learn more about how custom dimensions and metrics are collected, processed, and overwritten over at Google Support.
Like many areas of digital analytics, scope is a concept that can be extremely powerful when properly understood. Conversely, failure to consider scope when building your reports can adversly impact the integrity and relevance of your data.
A firm grasp of scope will give you the ability to translate your questions – and those of your clients – into meaningful reports. Distilling a measurement plan into appropriate combinations of dimensions and metrics is a key skill for all digital analysts, and scope is a key part of doing this successfully.
Thanks for reading! Please do let me know if you have any questions in the comments.