Download Report as PDF
October 3rd, 2018, with further improvements November 30th, 2018
Download Report as PDF could be a great addition for Data Studio, but the feature is currently limited by its inability to respect report filters, such as date range and dimension. The good news is that this has been acknowledged by the Data Studio team, so we will hopefully be seeing this changed soon. Until then, if you have edit permissions you can work around this limitation by updating the defaults before exporting, but if you’re going to go to the trouble of doing that it might be easier to simply screenshot and print, choosing Chrome’s option to ‘save as PDF’.
It’s not a lost cause though, since this feature has the added benefit of several additional configuration options.
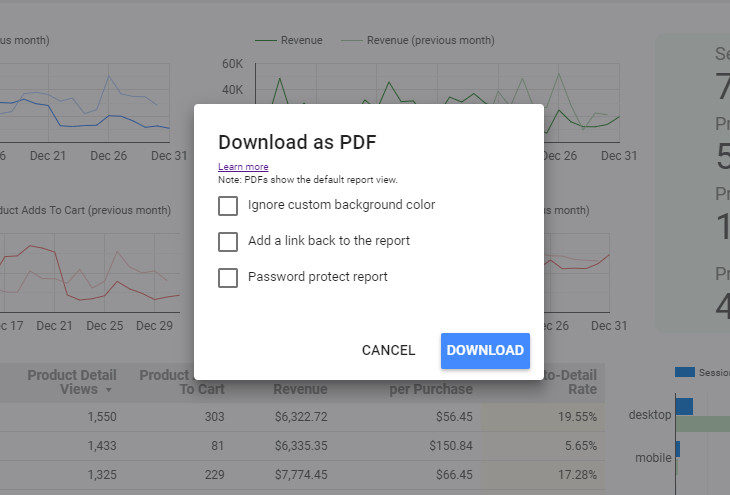
In my opinion, the most valuable option here is the ability to add a link back to the report if users want to dig deeper into the report or look at different date ranges. If confidentiality is important there is also the option to password protect the PDF. ‘Ignore custom background colours’ can reduce the noise of a report but can also lead to display issues, so be sure to double check your export.
Chart Interactions
My favourite feature to be added in the last quarter, Chart interactions lets you filter your reports by selecting the data you want to filter directly from charts or graphs. This feature isn’t available out of the box and will need to be enabled on the individual components you feel will benefit from it.
Give it a try yourself:

To remove the filter, you can either click on the data again or right click, then select Reset Action. This will speed up the time it takes end users to filter reports to get to the insights they need, as well as cleaning up Data Studio reports – dashboard creators that will no longer need to create countless filters across the report, since the ability to customise is instead baked into the components themselves.
Embed external content
First, we could embed Data Studio reports on websites, now we can embed websites in Data Studio reports. What a time we live in!
Data Studio is now becoming its own platform with the ability to embed YouTube videos, Google Drive documents (Slides, Sheets and Docs) and the ability to embed non-Google content, opening a whole new stream of possibilities in Data Studio.
The best use cases I have found involve embedding Google Drive Documents. You can have a Google Doc embedded with release notes or developer comments, Google Sheets with project timelines, or even a Google Slide with an insights deck.
There is also the ability to embed Data Studio reports within Data Studio reports. That’s right, Datastudioception. I tested this theory using the Google Merchandise Store report template:
Unfortunately, Google has foreseen the possibility that this could cause Skynet to become self-aware and so limited the number of embedded reports to three levels deep:

These new embedded features really do open up endless possibilities for what you can do with Data Studio, and it’s absolutely worth spending some R&D time exploring how it could be used to improve your own reporting structures.
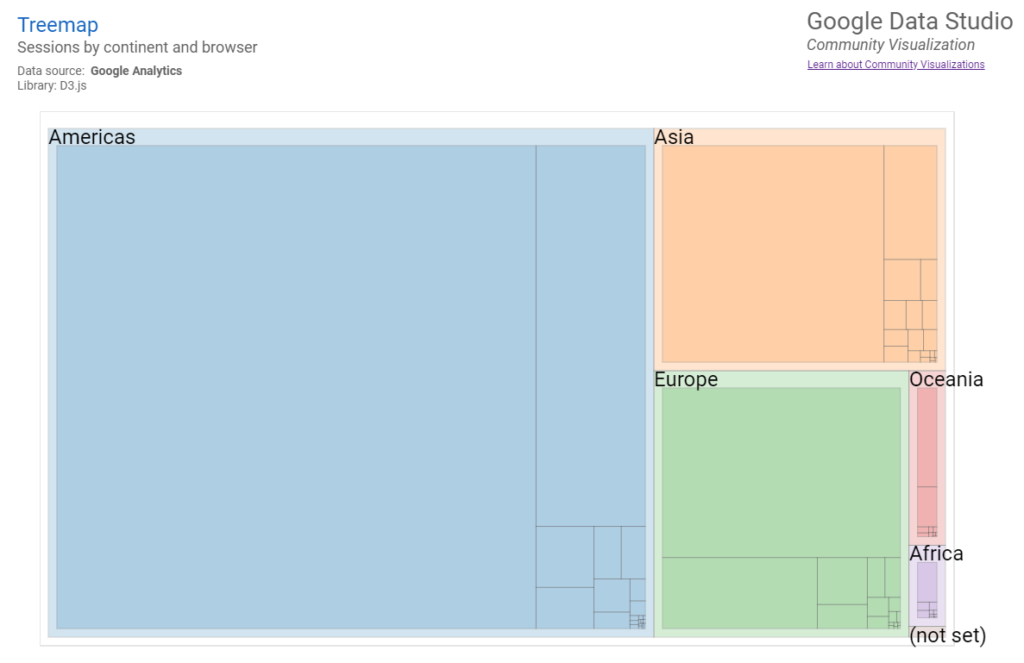
Community Visualisations
Community Visualisations aren’t fully available yet, but there are a few that have been released by the Data Studio Developer Relations team that show the potential this feature has for bridging the gap between Data Studio and other data visualisation tools. You can take a look at these on the Google Developer documents for Data Studio here.
Extract Data Sources
This was technically released before Data Studio left beta, but it’s well worth mentioning! The “Data Studio Explorer (Labs)” tool was released in July, and it lets users explore data sources without creating a report to do so. It’s useful for understanding new data connectors.
The new ‘extract data source’ function lets you use a subset of a data source within your report, making reports load faster. Combined with Data Studio’s cached data option this should help reduce long load times, getting the user the data they need, when they need it.
In case you missed it, BigQuery now includes the ability to ‘Explore data in Data Studio’. This feature also uses the Explorer, meaning you don’t need to export the table or manipulate it in BigQuery.
Smaller Updates
There have also been some smaller features released that are deserving of an honourable mention:
- Chart-Specific calculation fields – A quick way to implement calculated fields straight from the chart if they aren’t going to be used anywhere else, this saves time from having to go into the data source
- New “to date” options – Great addition to the date range however, we are still waiting on Last X Days, Weeks and Months here at Builtvisible.
- Week to date
- Week to date
- Month to date
- Quarter to date
- Year to date
- New options for handling missing data – this lets you choose how missing data appears in the graph between 0, No Data, – (hyphen), or null
- Duplicate filters and blended data sources – great if you are building complex dashboards, saving time from creating tons of individual filters
For a free data visualisation tool, Data Studio is a great addition to any marketer or analysts’ toolkit. We are excited to see what will be added in 2019, we are hoping for some improved design components, ability to save graph templates and more data features to get stuck into! Why not start the new year by testing out these new features, and if you get stuck, speak to the experts.