Drill-down improvements + table drill-down
June 20, 2019 + August 8, 2019
The drill-down feature enables viewers to reveal additional layers of detail within a chart. This allows users to have a high-level overview with the ability to further question trends by looking at more granular data.

Using the interactive Data Studio embedded above, once a user selects a specific country, there is the option to drill-down into the top regions for that country and then the data can be further broken down into cities.
This feature helps to move Data Studios from being static dashboards used for reporting, into a tool that can help teams generate insights from the data they are looking at – without being experts in analytics tools and platforms!
New text functions
Text functions in Data Studio are used to create custom fields and with the addition of extra text functions, formulas are slowly moving closer to being on par with Excel.
Here are the new functions and how you could use them in CASE functions to create new dimensions for your datasets:
- CONTAINS_TEXT — with Google Search Console data, this can be used to create a brand / generic dimension
- STARTS_WITH — starts with “https://” or https:// to look at the split of traffic visiting non-secure pages
- ENDS_WITH — ends with “/” to see proportion of trailing slash vs non trailing slash URLs
The last two are useful for URL manipulation and can be used in combination with other formulas such as LENGTH to extract certain parts of the URL
- LEFT_TEXT – Returns the first number of characters specified in a dimension, this could be used to extract the domain
- RIGHT_TEXT – Returns the last number of characters specified in a dimension
Treemap chart
Treemaps are a brilliant way to organise your data into dimension hierarchies, this can be useful when used to display the quantity of products. The only visualisation to be added this year, treemaps aren’t only new additions to the repertoire of charts to use but have also been turned into a crisp way to filter dashboards by Mehdi Oudjida
The drilldown feature can also be enabled on treemaps. This can be useful if you have multiple levels but too much information to display on one chart.
Themes
September 12, 2019, November 7, 2019
Themes had two updates this year, first was the introduction of theme colour when using the colour palette in Data Studio. This feature has instantly helped save me time when designing dashboards, no longer needing a notepad open with all my hex codes. Once custom colour is added to Data Studio, it appears in the selector under ‘Custom’ for future use.
The second feature to be released was Themes; these now give you the option to choose from a selection of default themes created by the Data Studio team as well as the opportunity to create your own Custom Theme. Using Custom Themes, you can choose to fully customise your dashboard from main colours to component settings like border shadow and radius.
These will automatically restyle your entire dashboard to match the options selected, leaving you with more time to focus on how your dashboard can best help the end-user.
Optional metrics
Further enabling the ability for dashboard interactions, the Data Studio team have now added the option to choose additional metrics that can be selected by users viewing graphs. This ability is great when you have a diverse range of end users, ensuring everyone has the data needed without having to replicate multiple charts.
You can have a maximum of 10 optional metrics on most charts and tables, with the only exception being pivot tables.
Conditional formatting
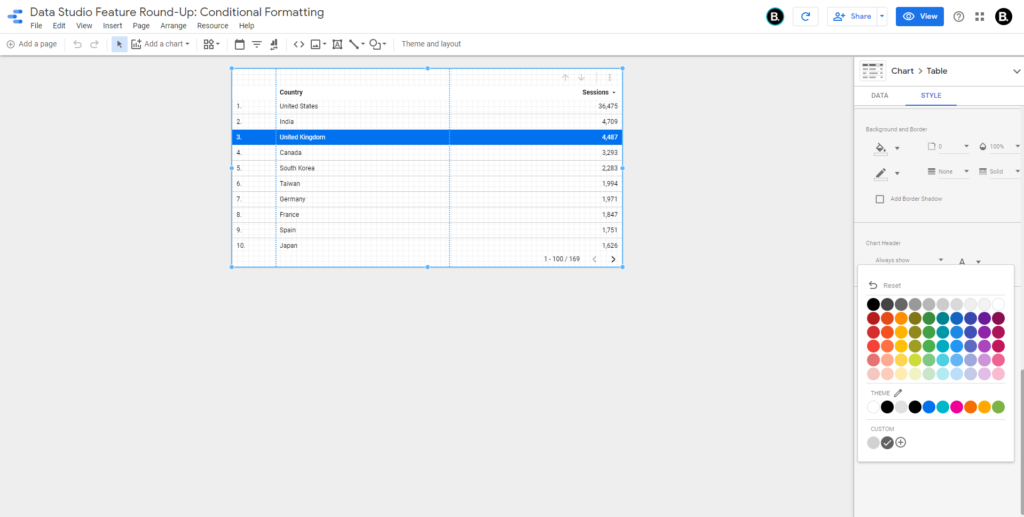
Conditional formatting is now available on tables within Data Studio, not only can you apply it in the traditional sense as a heat map on your metrics but with Data Studio there is also the option to apply this to dimensions.
In the Data Studio above I have set up a rule to highlight the United Kingdom. This is a useful feature to quickly identify main focus areas on tables as we are showcasing where this sits in the grand scheme. You can set up multiple rules on the same table and choose to affect a single row to the entire metric or dimension.
Small changes
- Pivot table interaction filters – chart interactions have now been added to pivot tables, if you hadn’t used them before I wrote an article about the feature
- Automatically set contrasting text colours in heatmaps and pie charts – these can be adjusted in the STYLE section on tables and pie charts
- Compare to Max – you can now choose to have metrics displayed as the percentage of the total
- Hide Page in View Mode – Neat little feature that allows you to hide a page from viewers of a report if you are adding new pages to an active dashboard
- Advanced date comparison – Ability to use advanced date range option in the comparison date range, if you haven’t used this feature before I have written about it in another article
Thank you to the Data Studio product team for another feature-filled year. Hopefully these new features will help you as much as they have us. Please let us know in the comments if there are any features you are hoping for in 2020 and if you get stuck, speak to the experts.