Introduction
1.1 What is a web server log file?
A file output from the web server containing a record of all requests (or ‘hits’) that the server receives.
The data received is stored anonymously, and includes details such as the time and date in which the request was made, the request IP address, the URL/content requested, and the user-agent from the browser.
These files exist typically for technical site auditing & troubleshooting, but can be extremely valuable for your SEO audits as well.
1.2 How does it work?
When a user types a URL into a browser, the browser first translates the URL into 3 components:
https://builtvisible.com/example-page.html
- Protocol
- Server name
- File name
The server name (builtvisible.com) is converted into an IP address via the domain name server, which allows a connection (typically via port 80) between the browser and corresponding web server, where the requested file is located, to be made.
An HTTP Get request is then sent to the web server via the associated protocol for the desired page (or file), with the HTML being returned to the browser, which is then interpreted to format the visible page you see on your screen.
Each of these requests is then recorded as a ‘hit’ by the web server.
1.3 Breakdown of a server log file
The structure of the log file will ultimately depend on the type of server and configurations applied, e.g. Apache, IIS etc, but there are several common attributes that are almost always included:
- Server IP
- Timestamp (date & time)
- Method (GET / POST)
- Request URI (aka: URI stem + URI query)
- HTTP status code
- User-agent
Example record including the above data:
188.65.114.122 - - [30/Sep/2013:08:07:05 -0400] "GET /resources/whitepapers/ retail-whitepaper/ HTTP/1.1" 200 "-" "Mozilla/5.0 (compatible; Googlebot/2.1; +https://www.google.com/bot.html)"
Additional attributes that can sometimes be seen include:
- Host name
- Request/Client IP
- Bytes downloaded
- Time taken
What is crawl budget and how is it calculated?
Not to be mistaken with ‘crawl rate’, which refers to the speed at which search engines request pages, ‘crawl budget’ refers to the number of pages a search engine will crawl each time it visits your site.
Crawl budget/allocation is very much determined based on the authority of the domain (historically PageRank) in question, and proportional to the flow of link equity through the site. The higher the authority, the more URLs crawled.
Why is crawl utilisation a fundamental consideration for SEO?
Having a larger crawl budget doesn’t necessarily translate into a positive trait, however, especially if search engines are crawling thousands of irrelevant, content thin URLs the majority of the time.
In the above scenario, in areas of lower authority the longer tail traffic drivers (or product pages) will be competing across a much wider net of URLs than necessary, leading to slower indexation rates, irregular crawl frequencies and ultimately restricting their ability to rank well organically. As such, conservation of your site’s crawl budget is key to ensuring its continued organic performance.
If you’ve been hit by Google’s Panda update, and are relying on the sole use of ‘noindex’ to set you free, you may as well give up now. If search engines are still crawling irrelevant, thin content types and they make up the majority of URLs on your site then you haven’t resolved the problem.
Conservation is the key to survival & growth
Working with Log Files
2.1 Tracking Search Engines
Combing your logs for search engine crawlers can be done broadly by locating the appropriate user-agent and filtering accordingly:
"Mozilla/5.0 (compatible; Googlebot/2.1; https://www.google.com/bot.html)"
You’ll then need to validate the IP range by carrying out a reverse DNS lookup to avoid any potential ‘fake’ user agents coming through.
There are a number of online tools that allow you to pop in the IP and return the corresponding host name, thus validating the IP against the user-agent.
When requiring a bulk lookup, however, these tools can become a bit of a chore. As we use Excel as the preferred tool for our log file analysis at Builtvisible, it also makes sense for us to look for a solution directly from our workbook, and thankfully there is one…
First detailed on Protocol Syntax, with the help of AlonHircsh and Arkham79 of experts-exchange.com, we can create an Excel VBA module to run this lookup for us:
- Open an Excel workbook and press Alt-F11 to open the VBA editor
- From the main toolbar, click ‘Insert’ > ‘Module’
- Copy and paste this code
- Head back to the Excel workbook, and use the following formula to activate the lookup on an IP address: =gethostname(A2)
A big thank you to Stephan for this incredibly useful and efficient module!
Pro Tip: Open a new Excel workbook and follow steps 2 & 3, then head back to the workbook and click ‘Save As’. Within the ‘Save as type’ field, select ‘Excel Add-In’:

The formula will then be available across all Excel workbooks, providing the add-in has been activated (File > Options > Add-Ins > select add-in).
2.2 Log File Analysers
Using a log file analyser tool can help to sift through large data sets with relative ease, and even export to smaller or more manageable files for auditing in Excel.
Log file analysers include:
| Analyser | Price Guide | Resources |
|---|---|---|
| Screaming Frog Log Analyser | £99 per year, but one of the best! | Announcing the SF Log File Analyser |
| GamutLogViewer | $20 – single license Licenses for 15, 40, and unlimited users available | Training videos |
| Splunk | Enterprise – free for 60 days Yearly & data consumption based subscriptions available | Basic Splunk for log file analysis |
| Command Line | Free There are also a number of log file utilities you can run directly from the command line. | Top command line tips: apache logs |
It’s worth noting that, despite their ability to crunch vast amounts of data, we have often found that using these tools can only take your analysis so far. Exporting to Excel opens up almost endless possibilities for investigation, with the ability to extend, combine, pivot and compare data points from additional sources.
2.3 Formatting Your Log Files for Excel
1. Convert .log to .csv
When you’ve extracted a web server log you’ll end up with a number of files with the .log extension. Converting these into a format that can be understood by Excel couldn’t be easier, just select the file and re-type the file extension as .csv. Excel will open the file without corrupting the contents (surprising I know, but it works!).
Working with multiple .log or .csv files?
We can quickly and easily convert and merge these files using the command line:
- Pop the .log (or .csv) files into a single folder on your desktop
- Head to ‘Run’ from the Windows start bar
- Type cmd and hit return
- Type cd Desktop/your folder and hit return
- Type
- If converting & merging multiple .log files to .csv type: copy *.log mergedlogs.csv
- If merging multiple .csv files type: copy *.logs
2. Sample Size
Upon opening the file in Excel, check to see how many rows of data it contains (this also reflects the number of hits). A good sample size/range to work with is between 60-120K rows of data, any more than that and Excel will likely become unresponsive once you start filtering, pivoting and combining other data sets.
3. Text-to-columns
Opening in Excel will usually result in the ‘hit’ data being recorded in a single column like the below:

To organise your data set into a manageable format we need to spread the data across multiple columns, this is where the ‘Text to Columns’ function comes in to play:
- First, select all of your data by clicking on cell A1 and pressing ‘Ctrl+A’ on your keyboard.
- Head to the ‘Data’ navigation pane, and select ‘Text to Columns’:

- In the pop up, ensure that ‘Delimited’ is selected and click ‘next’.
- The common separator within each cell (or hit request) of our data set is a space, so within the ‘Delimiters’ box tick ‘Space’. Ensure no other delimiters are selected, and click ‘Finish’.
- You’ll likely need to repeat this process for the ‘timestamp’ column, but replacing the space with ‘:’ to segment date and time into individual columns (just make sure you insert the required number of columns beforehand or you’ll overwrite the existing data).
4. Create a table
Now to start organising the data:
- Click on a cell within your data and press ‘Ctrl+A’, followed by ‘Ctrl+L’ and click ok.
- Start labelling the column headings accordingly (refer back to ‘Breakdown of a server log file’ for further assistance).
- Once labelled, remove any unnecessary columns from the data set (you’ll need the memory!)
Useful Tools for Technical SEO Auditing
Desktop Software:
- Screaming Frog
- URL Profiler
- IIS Search Engine Optimisation Toolkit
- SEOGadget for Excel
- Niels Bosma’s SEO Tools
- Sublime Text
Online Tools:
- Webmaster Tools (Google / Bing)
- Analytics (GA, Omniture, Coremetrics)
- DeepCrawl
- Structured Data Testing Tool
- GT Metrix
- Search Metrics
Identifying Crawl Accessibility Errors (Excel)
4.1 Exploring the Initial Data
Following the steps in the previous points, each data point will have been separated into individual columns in an Excel spreadsheet. The following data points are of interest at this stage of the analysis:
- Full Request URL (use =concatenate() to join the URI stem and URI query together)
- User-agent
- Timestamp (date & time)
- HTTP Status
- Time taken
4.1.1 Crawl Frequency vs User Agent
Creating a pivot table & chart based on the timestamp (date) property and filtering via specific User-Agents, such as Googlebot, G-bot Images, G-bot Video, G-bot Mobile etc, allows us to monitor crawl behaviour over time at a high level.
Your pivot table set up should reflect the following format:
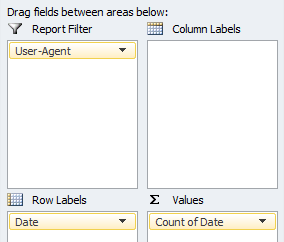
This can be extremely useful for quickly identifying anomalies with specific search engine user-agents.
4.1.2 Most vs Least Crawled URLs
Pivoting against request count of URL string allows us to see where search engines are spending the majority of their time during crawl, whilst also segmenting areas that have become crawl deficient.
Your pivot table set up should reflect the following format:
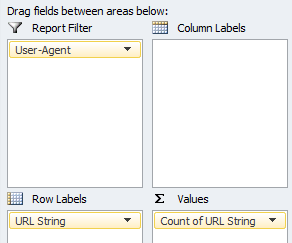
Whilst running through the data you’ll soon start to identify URL types that search crawlers just don’t need to be accessing (crawl waste).
Pro Tip: Create a column next to the request URL (excluding the domain) in your main data set, and add the following formula:
=IFERROR(LEFT(A1,SEARCH("/",A1,2)), "Root URL")This will trim the URL down to the top level directory, allowing you to then filter crawl behaviour by site sections to spot anomalies at an aggregate level.
As you come across error URL types, it’s recommended that you make a log of this within the main data set. This can later be used to calculate things like overall % crawl waste as a snapshot of search engine behaviour.
For each error type create a new column in your data set adding the following formula:
=ISNUMBER(SEARCH("searchthis",A2))This will carry out a look up directly on the request URL column for a specific text string and return a True/False value. The specific text should be the unique identifier from the URL generating the error e.g. ‘?parameter’, ‘/directory/’, file extension etc.
It’s not bullet proof for keeping a record of all error types particularly when addressing at a content level, and for anything other than a high level analysis of what search engines are encountering, it’s a time consuming process – which is why we need some more data!
4.1.3 HTTP Status – Requests vs Request URLs
Segmenting by server header response allows you to quickly assess direct crawl errors encountered by search engines. Pivoting request URLs vs count of requests will show if search engines are encountering the same error for a particular URL, or a range.
Seeing a % breakdown by HTTP response can help put into perspective crawl performance.
500 Server Error
If search engines are frequently encountering 500 server errors, not only will site crawl be impeded but you run the risk of those URLs dropping out of the index altogether.
Instead, returning a 503 response will inform search engines that the server is temporarily unavailable for maintenance, and they are thus to resume crawl at a later date (of which can also be specified as part of the header response).
404 Page Not Found
Sort these URLs by the number of requests by search engines to prioritise the handling of the 404 errors. A few 404 errors are not going to hurt your organic visibility, and is a perfectly natural occurrence for any website where a page is no longer available, and a related/similar page cannot be found.
However, to efficiently identify the appropriate action for the 404 requested URLs we’re going to need data from a site crawler like Screaming Frog, and traffic data from your site analytics.
We can then investigate the types of 404s occurring based on traffic and links (both internal & external) received to better gauge whether a 301 re-direct is the appropriate course of action.
302 Temporary Redirect
If your site employs 302 re-directs, check to see whether the ‘temporary’ response is valid for the requested URLs, as this type of redirect does not pass on the link equity accrued and maintains the index status of the origin URL.
In the majority of cases 302 re-directs will never be required, and should be replaced by 301 permanent re-directs. But in the slim chance that they are, you should be assessing whether the URLs should be crawled in the first place.
301 Permanent Redirect
Again, a totally natural occurring part of the web that search engines will expect to find.
If you’re seeing a large volume of 301s in your log files, chances are that you’ve either migrated platform/domain/structure recently, or there is a misconfiguration within the site itself that is firing the 301s, e.g. broken links, invalid rel=canonical status, legacy URLs within the XML sitemaps etc.
Any unnecessary 301 is of course going to delay site crawl, but also inhibit the flow link equity accrued by the origin URL. Although 301 redirects carry the vast amount of link equity over to the final destination, it isn’t passing all of that equity, and so, the more redirects encountered, the less link equity you can expect to be passed through the site.
Updating internal site navigation, XML sitemaps etc to point directly to the final destination URL will ensure that as much link equity as possible is being passed through the site.
This brings us on to another limitation of the raw log files, and that is the inability to identify ‘re-direct chains’. By combining the log file data with your crawler of choice, you’ll be able to pin down the number of re-direct chains (and count of ‘hops’ per chain) vs actual requests.
Pro Tip: Depending on the size of the data set and time span, you can carry out a lookup on the actual re-direct paths, to assess whether search crawlers actually followed the full ‘chain’, or halted their crawl short (a % overall complete crawl vs partial crawl would make for an extremely interesting study!).
4.1.4 Time Taken
With the time taken data point (measured in milliseconds) we can start to see which requested URLs on average by search engine crawlers have been downloaded the fastest/slowest.
Bucketing those URLs by directory will allow us to measure performance by site sections, to see which areas have been affected by slower performance.
However with the standard output we’ll be unable to see how much of the page is typically being downloaded, but we can still assess at high level overall site speed.
4.2 Expanding Your Data Set
Right, it’s time to start expanding our data set.
It’s worth bearing in mind that if you’re working with a large website, you may find it more useful to first split your log file data (based on category or product type) into separate documents, before then pulling the new data to allow for a deeper level analysis.
For now, just export the data from the tools below to new sheets within the same Excel document as your log file data:
Analytics (Google Analytics, Omniture, Core Metrics etc)
What data?
- A full export of all traffic by URL (pageviews).
Additional notes:
- 1-2 months of data depending on size of the site.
- Read our guide to Google Analytics for the correct configuration
Screaming Frog
What data?
- A data export from the ‘Internal‘ tab, following a ‘list mode’ crawl of all URLs encountered in the log files.
- Using the same crawl data above, obtain an export of the redirect chains report.
- Run a separate standard site crawl starting at the home page URL, and obtain an export of the ‘Internal’ tab so that we can obtain crawl level/depth, and no. internal links.
Additional notes:
- Don’t forget to select “Always Follow Redirects” from the advanced tab within the spider configuration.
Google WMT
What data?
- A download of all the URL parameters reported in WMT.
XML Sitemaps
What data?
- An extract of all the URLs contained in the XML sitemaps.
Additional notes:
- You can pull this data from directly within Excel, just head to the ‘Data’ tab > ‘From Other Sources’ > ‘From XML Data Import’ > pop in the URL of one of the XML sitemaps > repeat for the other files.
- If the XML sitemaps are clean & tidy we can rename this list as ‘Primary’ URLs, being a reflection of all URLs on our site that we’d like indexed.
SEOGadget for Excel
What data?
- Count of external links pointing at URLs featured within the log files.
- A separate export of top externally linked to pages on the domain using Moz, Majestic, or Ahrefs etc.
Additional notes:
- Use the below formula in Excel once installed to carry out a look up on the list of URLs from the log files:
=majesticAPI_toFit("GetIndexItemInfo", "fresh", A1:A1000)- A top pages export can be generated using the following formula:
=majesticAPI_toFit("GetTopPages","fresh","yourdomain.com","Count=1000")Combining Key Data
Before we can continue the analysis, we need to combine the key elements of these data sets with our log file data, so let’s break out some VLOOKUP’s to pull the following entities & columns from each sheet into our main log file Excel sheet:
- Analytics
- All traffic to URL (page views)
- Screaming Frog (‘list mode’ crawl based on URLs in our log file):
- HTTP Status Code (Rechecked)
- Content
- Title 1
- Meta Description 1
- h2-1
- Meta Robots 1
- Meta Refresh 1
- Canonical Link Element 1
- Canonical HTTP Status
- Size
- Word Count
- Outlinks
- External Outlinks
- Screaming Frog (‘Redirect Chains’ export based on the ‘list mode’ crawl from point 2 above)
- Number of Redirects
Unfortunately Screaming Frog doesn’t yet provide an easy way for us to see what the final destination URL or status is for these URLs in a single column, so we’re going to use a slightly different set of lookups here:
Final Destination URL:
=IF(C2=1,VLOOKUP(A2,redirects,7,0),IF(C2=2,VLOOKUP(A2,redirects,11,0),IF(C2=3,VLOOKUP(A2,redirects,15,0), IF(C2=4,VLOOKUP(A2,redirects,19,0), IF(C2=5,VLOOKUP(A2,redirects,23,0), "N/A")))))
‘C2’ = the cell containing the value for the ‘number of redirects’ in our log file data set
‘A2’ = the cell containing the URL we want to look up.
‘redirects’ = the name of our table containing the Screaming Frog redirect chains export.
This formula will check URLs that cycle through 5 redirects and return the final destination URL from the corresponding column. Just bolt on a couple more IF statements in the rare case you encounter more redirects.
Final Destination HTTP Status:
=IF(C2=1,VLOOKUP(A2,redirects,9,0),IF(C2=2,VLOOKUP(A2,redirects,13,0),IF(C2=3,VLOOKUP(A2,redirects,17,0), IF(C2=4,VLOOKUP(A2,redirects,21,0), IF(C2=5,VLOOKUP(A2,redirects,25,0), "N/A")))))
Works in the exact same way as the previous point, but returns the HTTP status of the final destination.
- Screaming Frog (based on the separate ‘standard’ crawl data)
- Level
- Inlinks
- Google WMT
- Add a new column for each parameter, and populate accordingly with the following formula to look-up against the ‘Request URL’:
=ISNUMBER(SEARCH("~?parameter", A2))Note the use of the ‘~’, which is placed in front of special characters/symbols so that Excel treats it as text. You could just use “~?” as the criteria to view all URLs containing a parameter for example.
- XML Sitemaps
- We want to see if the request URL is contained within the XML sitemap, and return a meaningful response. So let’s use the following formula:
=IF(ISNUMBER(MATCH(A2, sf[Address],0)),"Yes","No")‘A2’ = the cell containing the URL we want to check against the sitemap.
‘sf[Address]’ = tablename[ColumnName] – case sensitive
- SEOGadget for Excel
- External linking root domains
We should end up with a large table looking something like:
You can now tell why we recommend working with no more than ~100,000 requests!
4.3 Data Mining
I’m often asked our process behind mining log files for errors, and whilst there are common traits you can look out for, each website is unique in some way, and so the errors encountered will always be slightly different (even those using the same platforms!).
There will always be a need for analysing the data set beyond a set template, and so we’ll start by exploring different techniques for extracting the most value from your log files.
String Search & Pivot Tables
Remember this formula we referenced earlier:
=ISNUMBER(SEARCH("searchthis",A2))Extending this lookup across our new data will help to pin point specific error types, or can just be used as another mechanism to filter the data set.
Combining this with the use of simple pivot tables i.e. URL vs count of requests vs HTTP Status, or URLs that are set to ‘noindex’ is another way to identify accessibility or even content (relevancy) related errors.
Index Search & Negative Filters
An often over looked resource is the search engines themselves. Mining the ‘site:’ operator in both Google & Bing in combination with multiple ‘-inurl:[property]’ commands can quickly highlight areas for review within the log file data set.
You can typically insert ~10 ‘-inurl:’ operators before Google stops displaying results, at which point just switch those operators out, or view the remaining URLs with a normal inurl: command.
It doesn’t matter how large the site is either, you’re just looking for patterns, trends or anomalies at this point. Using this process you’ll soon come across something…
For example:
site:bbc.co.uk -inurl:/radio/ -inurl:/iplayer/ -inurl:/news/ -inurl:/weather/ -inurl:/food/

That 4th result above took me to the following page (jumping in the middle/end of the pagination on search results is another way to uncover issues):

The URL returned a 200OK at the time despite the ‘internal server error’ message displayed, but clicking the result underneath (5th result in the previous screenshot) returned content correctly.
Leveraging On-Page Components to Power Your Filters
This lead to another search investigating the scale of indexation by using a common component of the page template, in this case:
site:bbc.co.uk “Sorry, the server encountered a problem”
The search returned nothing out of the ordinary, so we then use the next common entity from the same page, “Please try again later”, and we find ~9K results:
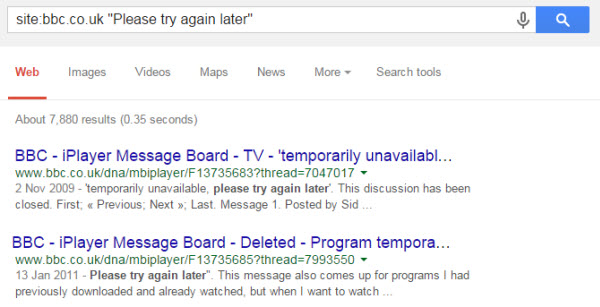
From checking those results we find that the /dna/ directory refers to a forum containing genuine FAQ’s regarding problems with iPlayer.
Knowing that this directory contains active content (I could investigate the ?thread URLs but I’m about to show you a clearer problem), the next step is to exclude this from my search so:
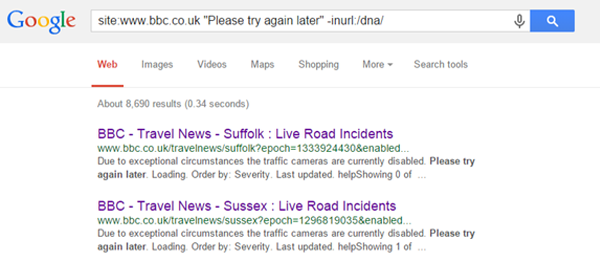
The URLs returned contain the parameter ‘?epoch’, which all result in blank pages on the BBC e.g.

There are ~4.8K URLs reportedly indexed in Google, and so by logging ‘?epoch’ as a lookup in our Excel document we can then view how many requests have been made for associated URLs.
The second screen above actually highlights another type of issue, one related to the archiving of content. So again we lift the common entity from the page and incorporate in a site command:
site:bbc.co.uk “This page has been archived and is no longer updated”
Archived URLs equate to over 1 million indexed results, which at this scale becomes more of a concern for crawl budget and content relevancy.
We’re just demonstrating the different sequences to locate potential problems, but if we were to extend this analysis, crawling the URLs within the log files and applying a custom filter within Screaming Frog to look out for “This page has been archived…” etc, we could see just how much crawl budget within our data set is being assigned to those URL types.
In summary:
- Use string search in combination with table filters
- Create & set up pivot tables using multiple data points
- Follow & extract common page entities to acquire new knowledge
- Extend data set with custom crawls
- Mine the site: command in search engines using multiple negative inurl operators to remove ok directories & URLs.
- Skipping to the end of the paginated results is another way to quickly uncover fringe/irrelevant page types.
The following points define some other steps to locate more specific accessibility issues using the data we’ve collected in the previous section.
4.4 Crawl % by File Type
Required data:
- ‘Content’ (file type)
Description
Part of the Screaming Frog crawl returned the property ‘Content’, which reports on the file type of the requested URL i.e. HTML, plain text, CSS, JavaScript, JPG, PNG etc.
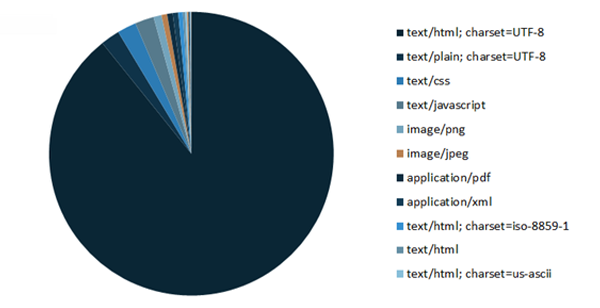
Creating a pivot chart with this data shows a high level view of what URL types are being crawled and how frequently.
Add a report filter for the HTTP Status obtained via the SF crawl, and you can clearly see a breakdown of requests vs the primary file types associated with specific errors, or just files consuming unnecessary crawl budget:
Result
For example in the above chart, ‘text/html’ makes up the largest portion of all 200OK requests, but 2nd on the list is ‘text/plain’ files –What are they? Why are they being crawled?
4.5 HTTP Status vs Redirect Errors vs Redirect Chains
Required data:
- The request URL ‘HTTP Status’
- ‘Number of redirects’
- ‘Final destination URL’
- ‘Final destination HTTP status’
Description
Within a new column in your Excel table add the following formula:
=IF(D2>1,"Error",IF(C2=404,"Error", IF(C2=302,"Error", IF(C2=0,"Error",IF(C2=400,"Error",IF(C2=403,"Error",IF(F2=404,"Error","ok")))))))
C2 = HTTP status of the ‘request’ URL
D2 = Cell (column) containing the number of redirect hops
F2 = HTTP status of ‘final destination’ URL
Result
This formula will tell us how much crawl budget has then been burned via requests resulting in one of the most common server errors, redirect error or chains.
4.6 Canonical Miss-Match & Status Errors
Required Data:
- ‘Canonical URL’
- ‘Canonical HTTP Status’
Description
The following formulas will allow us to understand whether the rel=canonical (if applied) matches that of the request URL, and if not, whether the HTTP status returns anything other than a 200OK response.
We first need to check if the canonical matches the request URL, and if one isn’t present ignore, so add a new column in your data set with:
=IF(M2="", "N/A", IF(M2=B2, "Yes", "No"))
M2 = Cell containing the canonical URL
B2 = Request URL
Then add another column with the following formula:
=IF(AND(O2="No", N2=404),"Error", IF(AND(O2="No", N2=302), "Error", IF(AND(O2="No", N2=301), "Error", "Ok")))
O2 = Cell containing the result of our previous formula
N2 = Canonical HTTP Status
Result
A simple pivot table using this data and we can quickly see:
- The total requests made for ‘true’ canonical URLs vs non-canonical
- Canonical references resulting in status error
Both of which can lead to the canonical tag being considered invalid across the domain, the tag after all is only a suggestion to search engines as opposed to a directive.
If the non-canonical URLs are being crawled more frequently, this is another indication that there is a problem with your site architecture and internal link structure.
4.7 Meta Robots vs Crawl Frequency
Data Required:
- ‘Meta Robots’
Description
Creating the following pivot table on the master data, will provide a clear overview as to the crawl frequency of specific Meta robots directives:
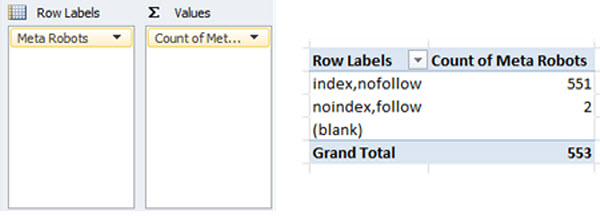
Result
Similar to the true canonical vs non-canonical URLs, if search engines are spending more time crawling URLs set to ‘noindex’ than those set to ‘index’, you’ll likely be experiencing issues with Panda.
4.8 Crawl Terminated or Restricted
Data Required:
- ‘Content’ (file type)
- The request URL ‘HTTP Status’
- ‘Outlinks’
Description
Create a pivot table using the following properties:
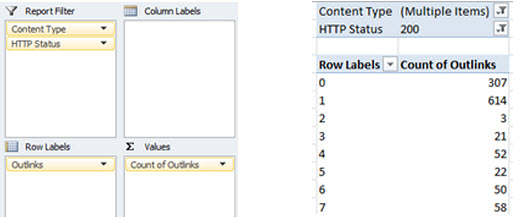
The use of the ‘Content’ and ‘HTTP Status’ fields as report filters will prevent false positives from being returned via file types such as CSS or JS that naturally do not include link elements, or URLs returning a 404 response etc.
Set these fields to only show text/html page types that return a 200OK response.
Result
- A pivot table displaying number of requests made for URLs containing X number of outlinks (sort low to high).
Applying the pivot table directly to the Screaming Frog crawl data (instead of the master log file data) will return unique requested URLs only as opposed to a total number of requests.
When search engines access a URL with 0 or very few ‘outlinks’ – defined as links pointing to other pages on the same domain – their crawl reaches a dead end, or they have limited options as to which page to crawl next, hampering overall crawl efficiency.
If you also imagine these links acting like a funnel for external link equity to be passed around your site, with 0 or few outlinks that link equity is being horded at these URLs.
4.9 Accessible Parameters
Data Required:
- WMT URL Parameters (& search string lookup on request URL)
Description
Using the search string Excel formula, add a column for each parameter reported by WMT and lookup the parameter name against the request URL.
Result
- Parameter vs number of requests
Assessing the relevance of these parameters in the operation of your site, can determine whether there is a need for keeping these alive, if not that’s an easy fix to help conserving crawl budget.
Yes, if a canonical is installed on the page then it’s not a duplicate content issue, but if you’re not helping search engines reach the true canonical via your main site navigation it’s still leading to crawl delays (or depending on scale, invalidation of the canonical tag).
If search engines do not need to access the parameters then simply disallow in robots.txt.
4.10 Duplicate Content & Request Frequency
Data Required
- SF full crawl data set
- ‘Title’
- ‘Meta Description’
- ‘h2’
- ‘HTTP Status’
Description
Create 3 pivot tables using the above components for both the main log file data set, and the SF crawl data, using the ‘HTTP Status’ as a report filter to only display URLs returning a 200OK response:
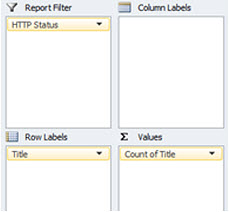
Replicate for the other properties, and then sort the ‘Count’ column within the pivot table from largest to smallest.
Result
- Number of requests made for each title, meta description & h2
Great for pin pointing potential accessibility issues at a content level, based on the amount of crawl budget allocated.
- Duplicate content
By applying pivot tables directly to the SF crawl data we can review ‘unique URLs’ as opposed to a count of requests, allowing us to easily extract potential duplicate content types, or at the very least cannibalised Meta data.
- Pages with missing Title, Meta Description or h2
The same pivot tables applied to the SF crawl data will also show pages with missing page elements.
Identifying Crawl Deficiencies (Excel)
5.1 Repurposing Your Log Files
When we analyse a server log file for SEO we’re typically concerned by what search engines are crawling and what accessibility errors they’ve encountered during this process. But let’s take a step back for a moment; if we know what search engines are crawling, we can quite easily find what isn’t being crawled just by obtaining a little more data.
The standard log files won’t tell us that we’ve accidentally blocked a directory containing URLs we’d actually want indexed, or that we forgot to put in redirects for a series of legacy URLs that have now become orphaned pages.
The logs will show areas of the site that have been crawled less frequently than others, but we still won’t have an understanding as to why that is the case.
This next section gives a new meaning to the phrase ‘crawl deficiencies’ through a series of steps that will not only identify areas of concern, but provide insight as to why.
5.2 Introducing More Data
New Required Data
- Site URL List via CMS export, XML sitemaps &/or site crawls ignoring robots.txt.
- Last mod date from the XML sitemaps if possible.
- Robots.txt directives for the website as a list in Excel
Existing Required Data
We’ll also be using the following properties as originally documented in point 4.2:
- Last mod data from XML sitemap
- Internal link count
- Inbound link count
- Word count
- Page size
- All traffic by page (pageviews)
- Depth (SF)
- Bytes downloaded
5.3 Visited Canonical URLs Blocked by Robots.txt
Data Required
- List of Robots.txt directives
- All traffic by page (pageviews)
- Full site URL list
- Content type
- HTTP status
- Canonical URL
Description
Carry out a ‘list’ mode crawl in Screaming Frog on the ‘full site URL list’ and export data from the ‘internal’ tab, placing this data on a new sheet in your Excel document.
Convert the data into a table, and then add a column for ‘Pageviews’ featuring a VLOOKUP formula to pull through the corresponding data for each URL.
Ensure that the ‘list of robots.txt directives’ can be found on a new sheet within the same document, then add a column for ‘Blocked by Robots.txt’ with the following formula contained:
{=IF(SUM(NOT(ISERROR(FIND('Sheet Name'!$A$2:$A$7,$A2)))*1)>0,P$1,"Non-"&LOWER(P$1))}PS. you may recognise this formula from Richard’s Keyword Research post on Moz.
‘Sheet Name’!$A$2:$A$7 – refers to the name of the sheet where the list of robots.txt directives can be found, with the absolute cell range $A$2:$A$7 reflecting the list size.
P$1 – change this to reflect the cell containing the column heading, where the resulting output for each cell should then be either “Blocked by Robots.txt” or “Non-Blocked by Robots.txt”.
{ } – the curly brackets turn our formula into an array, but can only be activated by pressing Ctrl+Shift+Enter.
Note: if the robots.txt directives contain a ‘?’, place a tilde ‘~’ operator beforehand so that Excel interprets the symbol as text when executing the formula.
Add a further column labelled ‘Canonical Match’ to assess the canonical URL field. If this matches the origin URL or if left blank, the URL is classified as a true canonical. The formula is the same as that used in 4.6:
=IF(M2="", "N/A", IF(M2=B2, "Yes", "No"))
We then need to create a pivot table with the following fields:
In Row Labels – add ‘URL’
In Values – add ‘Pageviews’
In Report Filter – add ‘HTTP Status’, ‘Canonical Match’, ‘URLs Blocked by Robots.txt’ and ‘Content Type’
Set ‘Canonical Match’ to ‘Yes’ & ‘N/A’, and ‘URLs Blocked by Robots.txt’ to true as well. Then filter the content type to only show HTML page types.
Result
- List of traffic generating URLs blocked by robots.txt, that return a 404
These URLs will naturally not be reported in WMT, but are still a concern for users especially when these URLs are generating traffic.
- List of traffic generating ‘true canonical’ URLs that return a 200OK, but are blocked by robots.txt
If they are generating a substantial amount of traffic and are useful to users, you should be considering removal of corresponding disallow rules.
5.4 Externally Linked to Canonical URLs Blocked by Robots.txt
Data Required
- All data in point 5.3
- External links to URLs
Description
Building on point 5.4, by collecting link metrics for the true canonical URLs we can see where external link equity is also being supplied but not carried due to the robots.txt disallow rules.
We’re going to be using the formula described in point 4.2 for the SEOgadget for Excel add-on, to retrieve a count of external linking root domains for each URL:
=majesticAPI_toFit("GetIndexItemInfo", "fresh", A1:A1000)The below formula can then be used to mine the backlinks for specific URLs that have generated a larger number of linking root domains:
=majesticAPI_toFit("GetBackLinkData","fresh","builtvisible.com","ShowDomainInfo=1,Count=5")A quick pivot table with the following fields:
In Row Labels – add ‘URL’
In Values – add ‘External Linking Root Domains’
In Report Filter – add ‘HTTP Status’, ‘Canonical Match’, ‘URLs Blocked by Robots.txt’, ‘Content Type’ and ‘External Linking Root Domains’.
Set ‘Canonical Match’ to ‘Yes’ and ‘N/A’, ‘URLs Blocked by Robots.txt’ to true, ‘Content Type’ to show only HTML page types, and filter the linking root domains to only show URLs generating more than 1.
Sort the values column from high to low.
Result
A list of top externally linked to true canonical URLs currently blocked by robots.txt
Assess whether the URLs are still relevant to users and contain unique content, then consider removing the disallow rules or making exceptions.
If the URLs are no longer required, consider implementing 301 redirects and again lifting the robots.txt rules so the link equity can be passed.
It’s not always that simple however, especially if there are other URLs within the same directory that offer little value for example, but at least by understanding how much link equity is being lost you can make an informed decision as to whether exploring an alternative is a viable option.
5.5 True Canonical URLs Missing from XML Sitemap
Data Required
- Download of XML sitemap(s) to Excel
- ‘Canonical URL’ from SF crawl (point 5.3)
- HTTP status
- Content Type
Description
Within the same data set we should already have a column for ‘Canonical Match’, returning a value of N/A, Yes, or No.
We then need to add a column with the heading ‘URL in XML Sitemap’ and carry out a VLOOKUP on the table containing a download of the XML sitemap(s).
And lastly, add a column with the heading ‘No. of requests’ and apply the following formula to the column:
=COUNTIF(range, A2)This will then count the number of requests made by GoogleBot for the specific URL.
Once this data is in place, create a pivot table with the following properties:
In Row Labels – add ‘URL’
In Values – add ‘No. of requests’
In Report Filter – apply and set the following filters:
- HTTP status – ‘200 OK’
- Canonical Match – ‘Yes’ & ‘N/A’
- URLs Blocked by Robots.txt – ‘No’
- Content Type – ‘HTML’
- URL in XML Sitemap – ‘No’
Result
List of 200OK HTML pages not in the XML sitemap, by total requests made by Googlebot
5.6 % URLs Crawled by Click Depth
Data Required
Master log files:
- Depth (Level)
- Content Type
- Recheck status
Separate SF full site crawl data:
- Depth (Level)
- Content
- Status Code
- Not blocked by robots.txt
Description
Create a pivot table for both the main log file data set, and the separate crawl carried out by Screaming Frog.
The ‘Depth’ (or Level) field should be used as both a row label and as a value with the field settings of ‘Count’. The HTTP status, content type and blocked by robots.txt fields should then be used as report filters, set to only display HTML pages returning a 200OK status accessible to search engines.
Result
Overlaying the two data series on a single chart and you can quickly see whether there is an architecture problem based on crawl frequency:
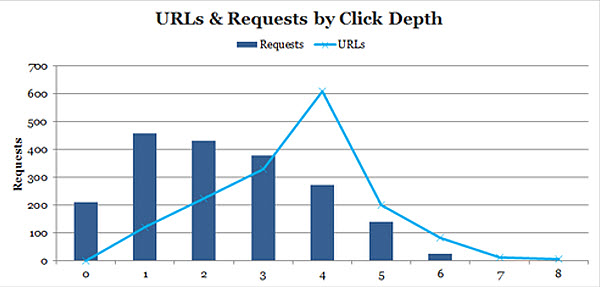
In any scenario where the number of URLs outweighs or is near equal to the number of requests, there’s a problem with your site architecture. The deeper the architecture, the less link equity / authority passed to deeper level URLs, and the harder search engines have to work to crawl & index your content.
From the separate SF crawl data we immediately have a list of URLs that haven’t been crawled.
Now we may want to look at the URLs that are at a depth of 4 onwards to check whether those content types should be crawled & indexed in the first place. Beyond that, you should be assessing your internal link structure to aid in flattening the architecture e.g. main site navigation (drop down menus), popular searches, hot products, new products etc (see point 5.7 for more details).
For large ecommerce sites, leverage your most common content type, product URLs. A site may have a thousand categories (top, sub, sub sub etc), but well over 10,000+ products. A single link on each product is an additional 10,000+ links in your architecture, so why not use this as a way to leverage further exposure of your deeper level categories.
Pro Tip: Run another Screaming Frog crawl, but change the start point of your crawl to a deeper internal page. Overlay this data with the chart above and compare the differences. A strong architecture doesn’t just revolve around the number of clicks from your home page, but the number of clicks from any page on your website.
5.7 Requests vs. Internal & Inbound Links
Data Required
All data is located within the separate SF crawl used in the previous points:
- No. of Requests (point 5.5)
- HTTP Status
- Canonical Match
- URLs blocked by Robots.txt
- Content Type
- Inlinks
- External linking root domains (point 5.4)
Description
Building on point 5.6, create a pivot table using the following settings:
In Row Labels – add ‘URL’
In Values – add ‘No. of requests’, ‘Inlinks’, and ‘External Linking Root Domains
In Report Filter – apply and set the following filters:
- HTTP status – ‘200 OK’
- Canonical Match – ‘Yes’ & ‘N/A’
- URLs Blocked by Robots.txt – ‘No’
- Content Type – ‘HTML’
Result
Sort the ‘No. of requests’ column low to high, and begin investigating the URLs returned by the number of internal and inbound links to see if either is a potential contributing factor to the limited number of requests generated.
5.8 Incomplete Crawl / Download
Data Required
- Page Size
- Bytes Downloaded
- Content Type
- HTTP Status
- Canonical Match
Description
This time using the main log file data set, we’re interested in the fields ‘Page Size’ and ‘Bytes Downloaded’.
Create a pivot table with the following properties:
In Row Labels – add ‘URL’
In Values – add ‘Bytes Downloaded’ and ‘Page Size’, altering the value field settings both to show ‘Average’. The ‘URL String’ (or URL path) field should also be added and set to ‘Count’, so we can compare the data against the number of requests for each URL.
In Report Filter – apply and set the following filters:
- HTTP status – ‘200 OK’
- Canonical Match – ‘Yes’ & ‘N/A’
- Content Type – ‘HTML’
Sort the average of bytes downloaded column from lowest to highest.
Result
By comparing the bytes downloaded data from the log files with the actual size of each URL, and averaging across the duration of the log file data we can see just how much of each page is typically being downloaded by search engines.
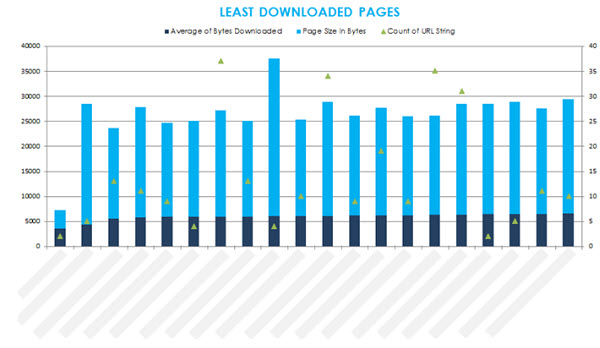
The ‘least downloaded pages’ view is a fantastic way of quickly identifying pages that typically possess characteristics associated with Panda, and is generally in line with the number of requests for those URLs.
5.9 Aged & Thin Content Types
Data Required
- No. of Requests (point 5.5)
- Last Mod Date from XML sitemaps
- Word Count
- Content Type
- HTTP Status
Description
From the standalone SF crawl, create a pivot table with the following properties:
In Row Labels – add ‘URL’
In Values – add ‘Last Mod Date’, ‘No. of Requests’, and ‘Word Count’
In Report Filter – apply and set the following filters:
- HTTP status – ‘200 OK’
- Content Type – ‘HTML’
Switch between sorting the ‘Word Count’ & ‘Last Mod Date’ from low to high/old to new.
Result
This is another tool for helping to assess why a particular URL is being crawled less frequently. If a page hasn’t been updated for quite some time, contains very little useful & unique content, and is experiencing low crawl frequency, you can probably bucket those URLs with the others most at risk of Panda.
Impact Reporting
As part of the auditing process we’ve already created several charts & reports which are extremely useful when getting down to the nitty gritty details, but don’t provide us with a high level view of overall crawl performance.
As mentioned at the beginning, we’re trying to answer the following questions:
- How much crawl budget is being wasted and where?
- What accessibility errors were encountered during crawl?
- Where are the areas of crawl deficiency?
The below charts (although not limited to) will help to sum up overall crawl performance for your website.
Wasted Crawl Budget
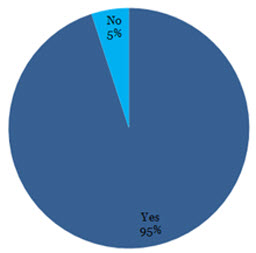
The above chart was generated from an analysis of a well-known high street retailer (and yes that figure is correct, 95% of their overall crawl allocation was being wasted!).
As we’re logging every error we identify somewhere within Excel, a few lookups across our data and we can combine a simple “is this URL an X error? Yes/No” style series of columns within the main log file data set, where filtering to ‘Yes’ returns the total number of requests made for URLs resulting in that error type.
Aggregating that information again and we have the data to generate the chart you see above.
Here is the formula you’ll need to carry out the lookup:
=IF(COUNTIF(L2:T2,"Yes")>0,"Yes","No")
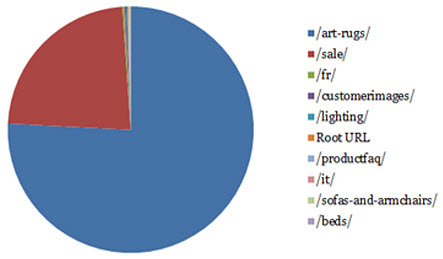
Crawl Waste by Product
If you understand which product types generate the core of your revenue, you could even break this data down by product just by aggregating at a directory level e.g.
Crawl Deficiencies
The exact same applies to logging each type of crawl deficiency within Excel, with the output being a high level snapshot of URLs that have been affected in some way:
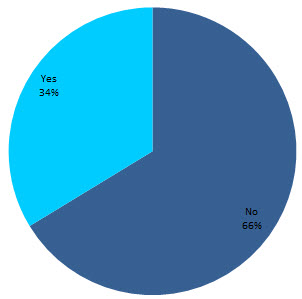
Crawl Waste by Error Type
Provide a clearer view of the errors identified based on the number of requests for URLs of that nature:
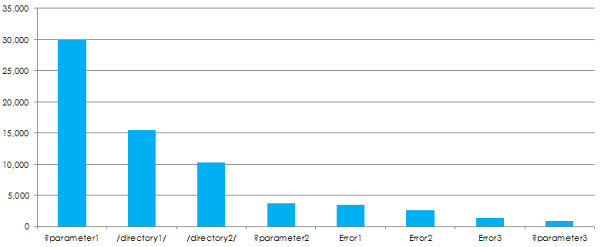
This report can also then be pulled for ‘crawl deficiencies’.
Crawl Waste by User Agent
Comparing overall requests by user-agent can yield some interesting behaviour:
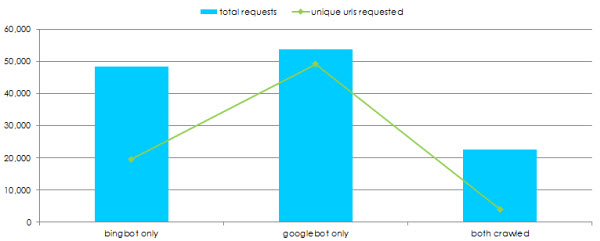
In the above instance, Bing tends to work with a much smaller bucket of URLs but crawl those more frequently, whereas Googlebot has a much larger bucket of URLs which are crawled less frequently.
There is also very little cross over in what both user-agents are crawling, with over 50% of requests by each user-agent unique to that crawler.
Extending Your Log File Analysis
There are so many data sets of which this log file auditing process can be applied, that we’ve really just scratched the surface by focusing on a typical search engine crawler in this guide (maybe I’ll release a follow up post on that :)).
If you really want to assess the overall performance of your site, experiment and compare other user agents e.g.
- Google, Bing, Yahoo, Yandex, Baidu etc
- Images
- Video
- Mobile / Smartphone
- News
Think of the typical SEO (and even user) generated issues associated with that type of content e.g. is Googlebot Mobile incorrectly crawling the desktop site, despite redirects being in place to a standalone live mobile site? Log files can show you that information!
Again, you may even need to combine your analysis with other data sets like we’ve done in this guide to explore at a much deeper level.
Log files – the possibilities are endless!
Resources
Hungry for more? Then be sure to take a look at some of these fantastic articles:
- SEO Finds in Your Server Log – Part 1 & Part 2 by Tim Resnik
- Googlebot Crawl Issue Identification Through Server logs – by David Sottimano
- Crawl Optimization – by AJ Kohn
- How (I Think) Crawl Budget Works (Sort Of) – by Ian Lurie
- Log File Analysis – The Most Powerful Tool in your SEO Toolkit – by Tom Bennet
- Get Geeky with GREP as an SEO Tool – by Ian Lurie
- A Technical SEO Guide to Crawling, Indexing and Ranking – by Paddy Moogan
- An Introduction to Log File Analysis for SEOs & Webmasters – by Eric Lander
- 30 Best New SEO Tools – by Richard Baxter