What returns data really says about Marketing
The key to preventing skewed figures is to ensure you collect returns data within your Google Analytics account too, as this gives marketing teams visibility of genuine performance. More importantly, it allows you to optimise advertising spend towards retained revenue and avoid paying twice on sales which will be returned.
Since returns are typically processed offline, this part of the picture is often overlooked and understanding profitability is left to business analysts. All well and good, but that usually happens after the sales cycle.
In this post we’ll look at how you can complete the picture by bringing your returns data into Google Analytics, and what you can do with it once it’s there to refine activities and reduce those returns.
How to collect the right data in Google Analytics
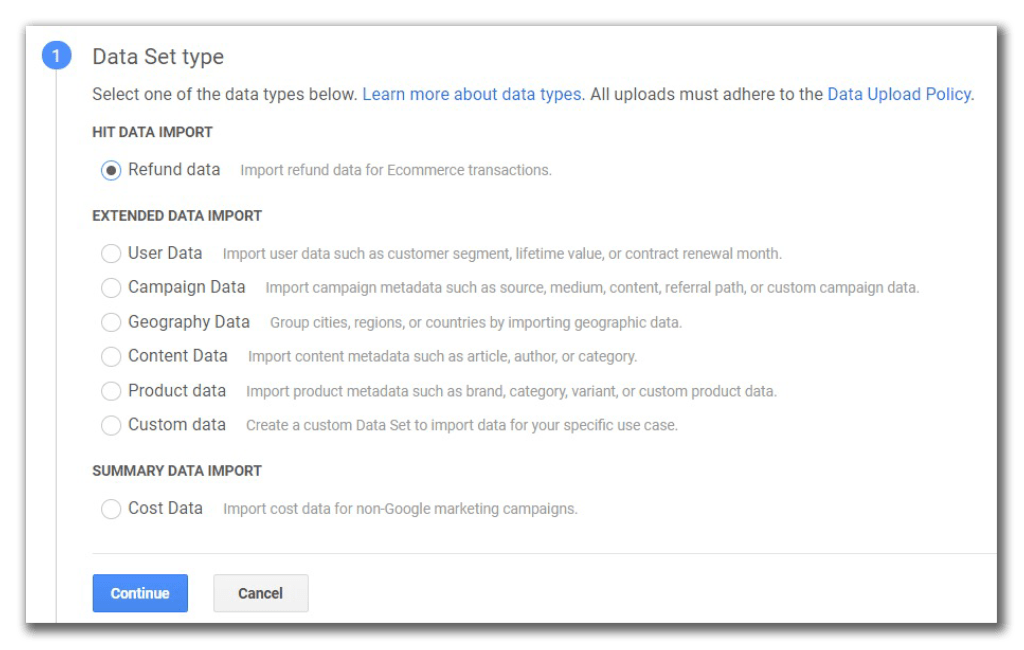
If you’re using Enhanced Ecommerce (of course you are!) then you can easily collect returns data in Google Analytics using the Refund Data Import feature. Google Analytics allows for both full refunds, i.e. the cancellation of the whole order, and partial refunds, i.e. returns of a specific item within the order. Be aware however, you can only import either full or partial refunds in a single data import file so you’ll need to upload separate files for each case.
To set up the refund import, head to the Data Import section of the property settings and create two new “Refund data” data sets – one for full refunds, one for partial.
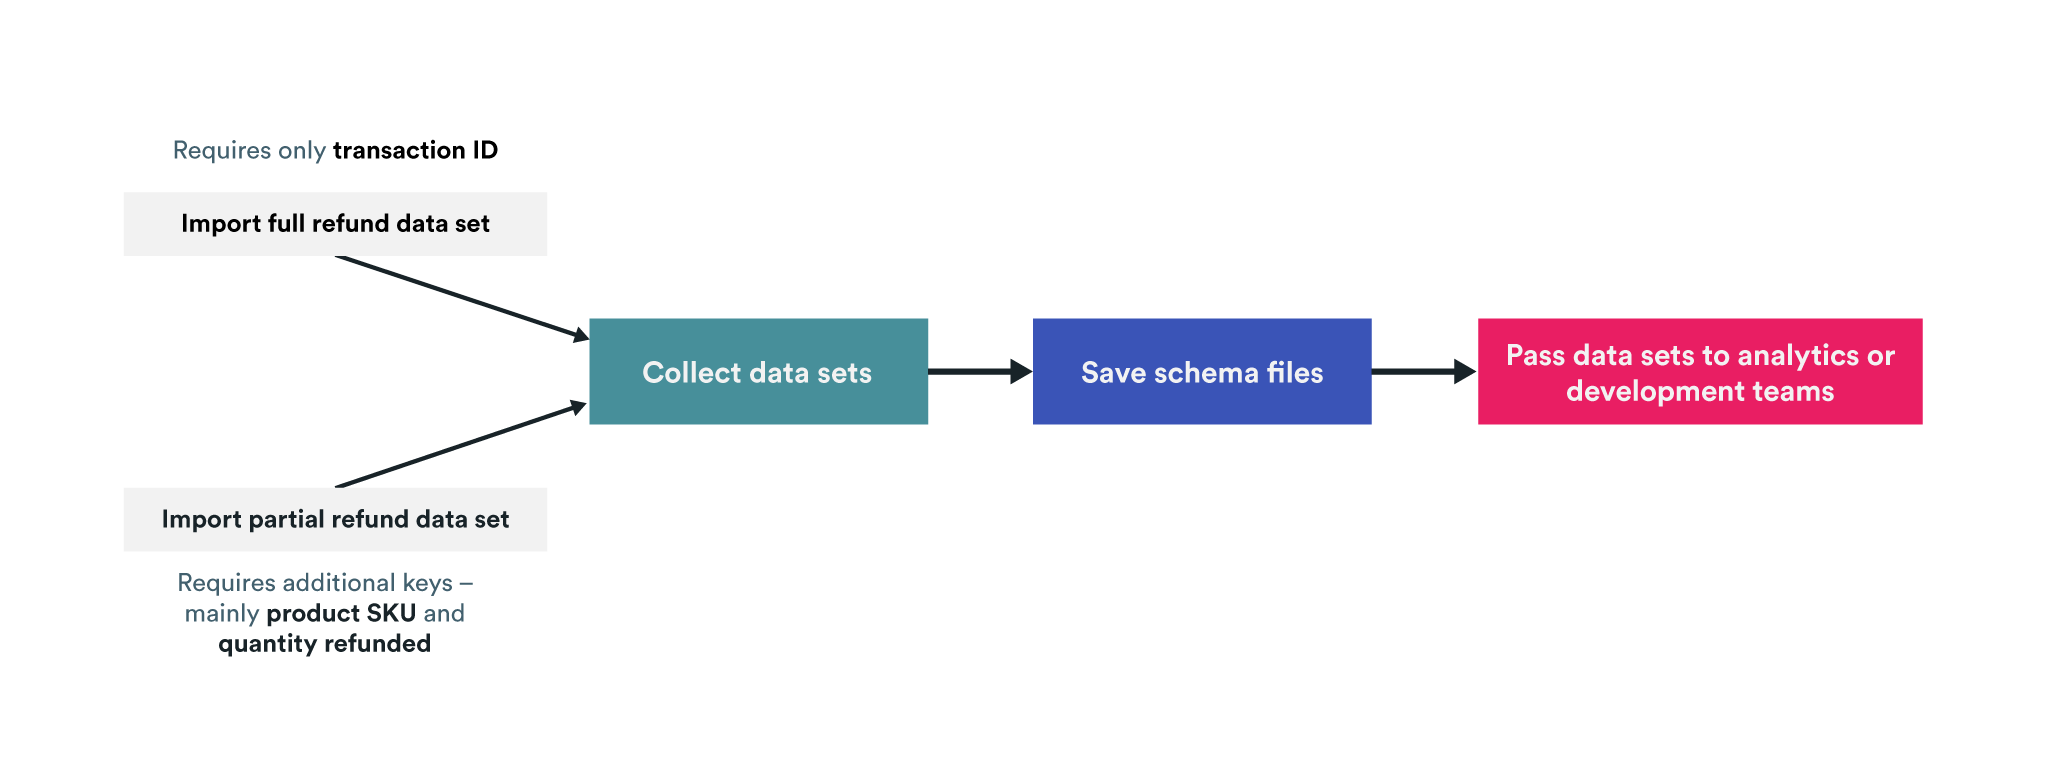
For your full refund data set, you only need to supply the transaction ID and GA will take care of the rest, so you can go ahead and save that data set straight away.
For your partial refund data set, you’ll need to supply some additional keys – product SKU and quantity refunded are the main ones.
Once you’ve got your data sets, save the schema files and pass these to your analytics or development teams to have them populated with the returns data.
Then, to get the data into Google Analytics you can import via the UI or, preferably, use the Management API to automate that process periodically (I strongly recommend getting the API uploads on the development agenda, it will make the data collection much more robust and is a good use way to keep your devs busy during code freeze).
It’s important to note you can only import refund data for transactions that occurred within the last 6-months. That’s usually more than sufficient to cover most returns policies, but if you’re being very generous to your customers, you’ll need to ensure returns of older transactions are not included in your files. Also recommended is to only import refund data for transactions which are at least 48 hours old, to ensure the transactions have been processed by Google Analytics (if it hasn’t been, the refund can’t be applied).
What can you learn from your returns data?
Imported refund data will be used to adjust the order details of the original transaction, this means the historical data within your ecommerce reports will adjust based on the imported files. It will take some getting used to of course, as typically we expect data to remain consistent after collection, but the benefits are worth it.
With the returned transactions and/or products removed from your ecommerce reports, you now have a much more accurate picture of site and marketing performance, which more closely mirrors reports you may receive from your BI teams.
Opportunities for optimisation
While paid media may be the most obvious route for optimisation, there are plenty of other areas this can be applied if you combine it with other data points.
For example, we often look at whether PDP features (e.g., model vs product imagery, product demo videos, etc.) lead to a conversion benefit, but what about an improved return rate? If you’re not analysing this, your product teams’ CRO efforts may be missing a trick.To do this, you will need to ensure you are collecting these features, or the CRO experience ID, in a custom dimension, so that you know which orders were made in sessions exposed to each.
Alternatively, if custom dimension slots are limited, you could analyse this impact as part of a phased roll-out so that only specific lines get the new experience, and you can measure the impact on the return rate for those lines vs the unoptimized lines.
These are just a couple of examples of how you can use your returns data to improve existing marketing efforts. As ever, there are plenty of alternatives so explore and see what works best for you.
Final thoughts
Returns data is often overlooked because it is an offline process, but it’s absolutely key to having an accurate view of sales performance and collecting it opens up some really interesting opportunities for existing optimisation, both on and off site.
Though Data Import can appear fiddly and daunting if you’ve not used it before, refund data is one of the simplest use cases to get started with.
You can also lean on your development teams to get the actual imports automated – with code freezes likely in place for many, it’s a good time to pivot from on-site tracking to these back-end tasks.