Understanding Performance with Organic Traffic Acquisition
Traffic measurement in GA4 vs UA
One of the key metrics to look into when checking SEO performance is traffic to the site and how much of it is a result of organic search. You can easily see this by looking at the Acquisition reports in GA4 by navigating to Reports > Life cycle > Acquisition. Here, you will find 3 default reporting options:
- Acquisition Overview
- User Acquisition
- Traffic Acquisition
The Acquisition Overview report shows a dashboard summarising your website traffic through a couple of cards, with most linking to more detailed reports.
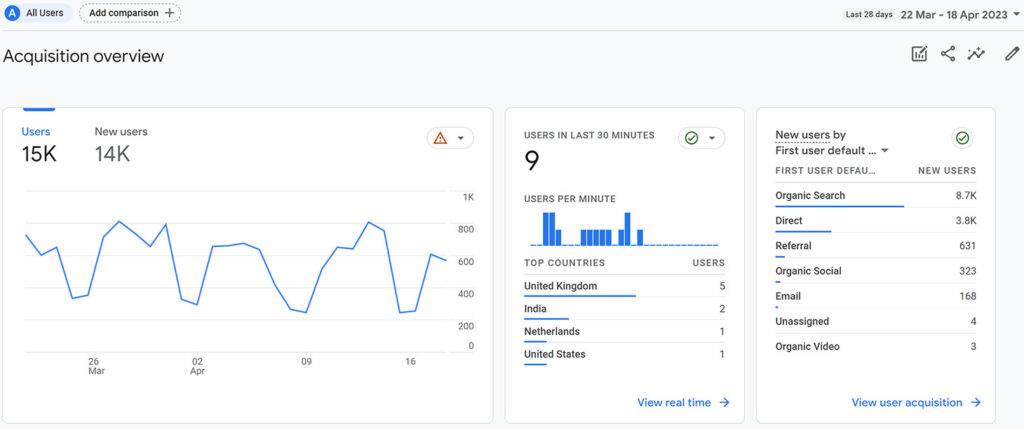
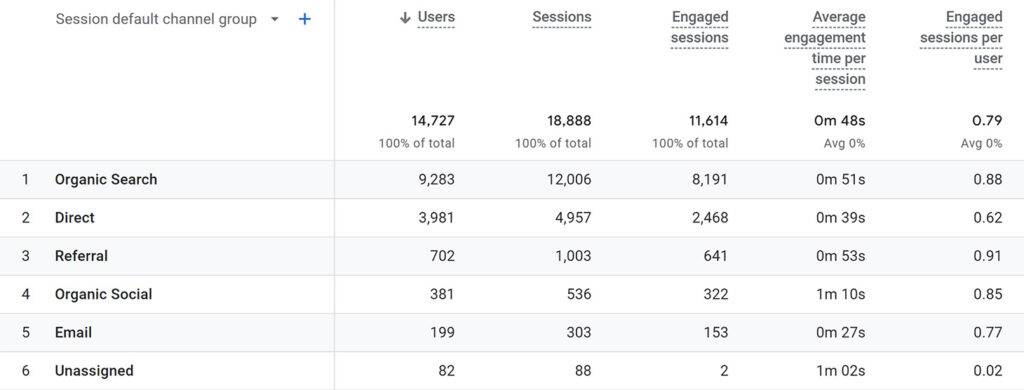
The next two reports look similar but have slight differences and can also be broken down further to gain deeper insights. The User Acquisition report presents channel data based on the first traffic source that led a user to your website.

Whereas the Traffic Acquisition report highlights channel data based on the last data source that led a user to land on your site.
Data segmentation and comparison
The fun starts when you can break this information down even further. Using the comparison tool will help you really understand what’s working best so you can make informed SEO strategy decisions. This tool in GA4 is similar to using segments in GA-UA. What makes GA4’s comparison tool special, however, is it’s more user-friendly and easy to customise. All the standard reports in GA4 have a filter and comparison button at the top of the page, allowing you to segment exactly what you’re looking for.

This means you can filter the reports to show all users that arrived at your site organically. You can then change the default channel group using the drop-down.
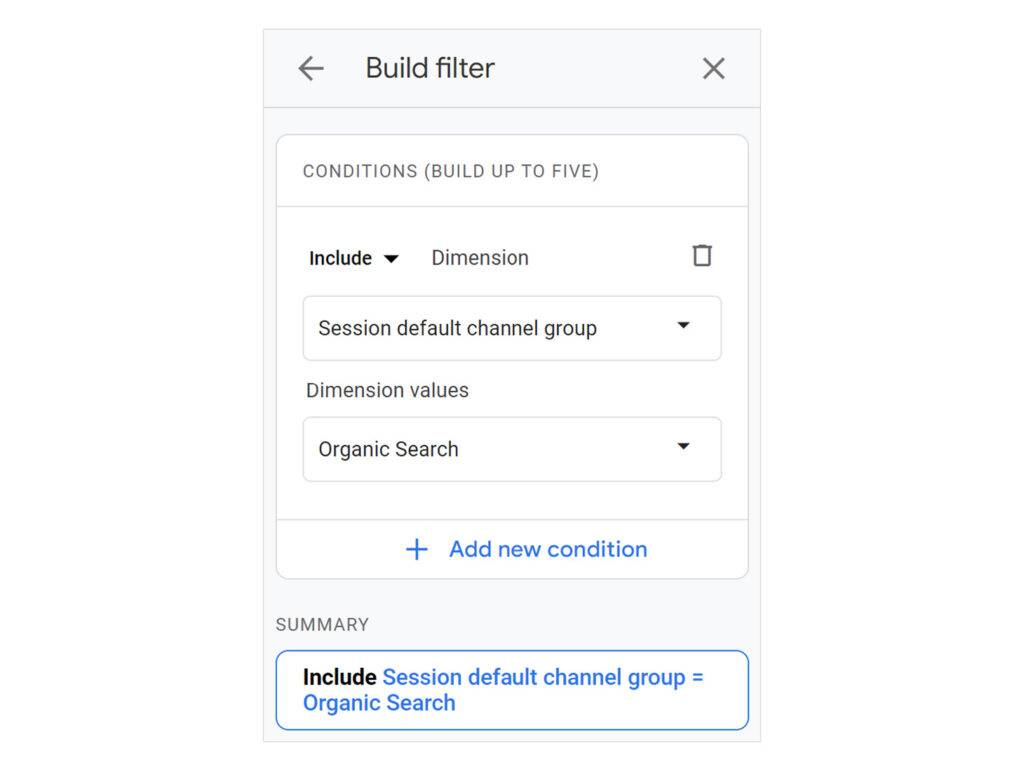
Switch it to session source and medium to compare the performance of different search engines i.e “google / organic” vs “bing / organic”.

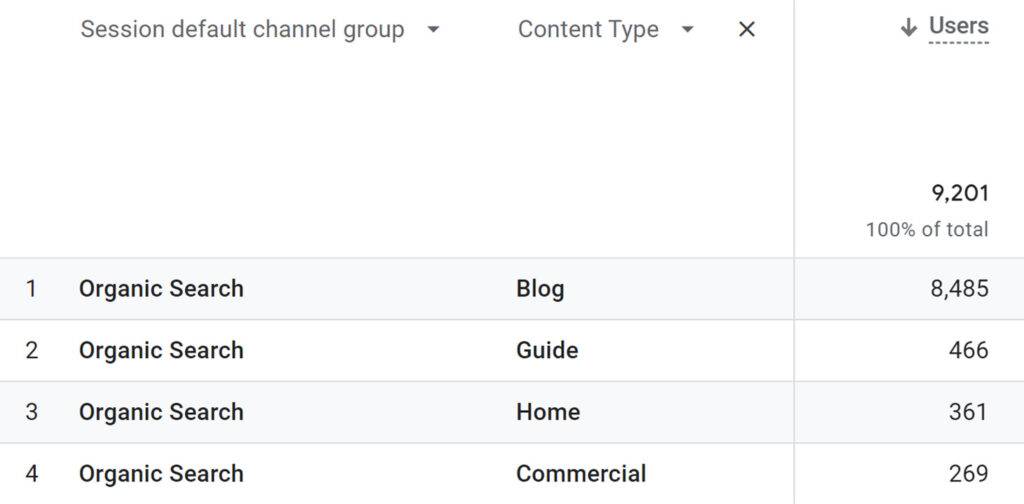
You can also change it to landing page + query string and see your best organically performing landing pages. You can also apply this fitler tool to the rest of the reports such as Events in the Engagement section. You will need to select and update the audience filter at the top of the page, beside the comparison tool, which is set to ‘All Users’ by default. This means you’ll be able to focus on your key audience and how they interact with your site, so you know what’s working and what’s not. Break down your table further by combining it with a secondary dimension such as the content type, for deeper insights.
Key GA4 metrics to measure SEO impact
Diving into the key metrics available in the GA4 reports is a crucial step in determining the quality of an SEO campaign and understanding your users’ behaviour. Here are some metrics for measuring organic performance:
- Sessions: Looking at the number of sessions helps you recognise the impact of your site’s SEO
- Engagement rate: If you want to check your content’s relevancy, look into the engagement rate. This is a new metric in GA4 which looks at the number of engaged sessions (the number of sessions that lasted longer than 10 seconds, had a conversion event, or had two or more screen or page views) over the total number of sessions. This gives a more detailed picture as to how relevant your content is and helps you spot trends in users’ behaviour
- Revenue: For e-commerce sites, focusing on the revenue generated and number of conversion goals completed will allow you to see how much value your SEO has produced
Dig Deeper with Google Search Console integration
Unlock new reports and metrics
If you haven’t connected your GA4 property to Google Search Console (GSC) yet, I highly recommend you do! Once you integrate, you’ll gain access to new sets of reports which allow you to analyse data from GSC directly within GA4. In the GA4 navigation menu, two new reports will show up automatically: The Google organic search traffic report and the Queries report.
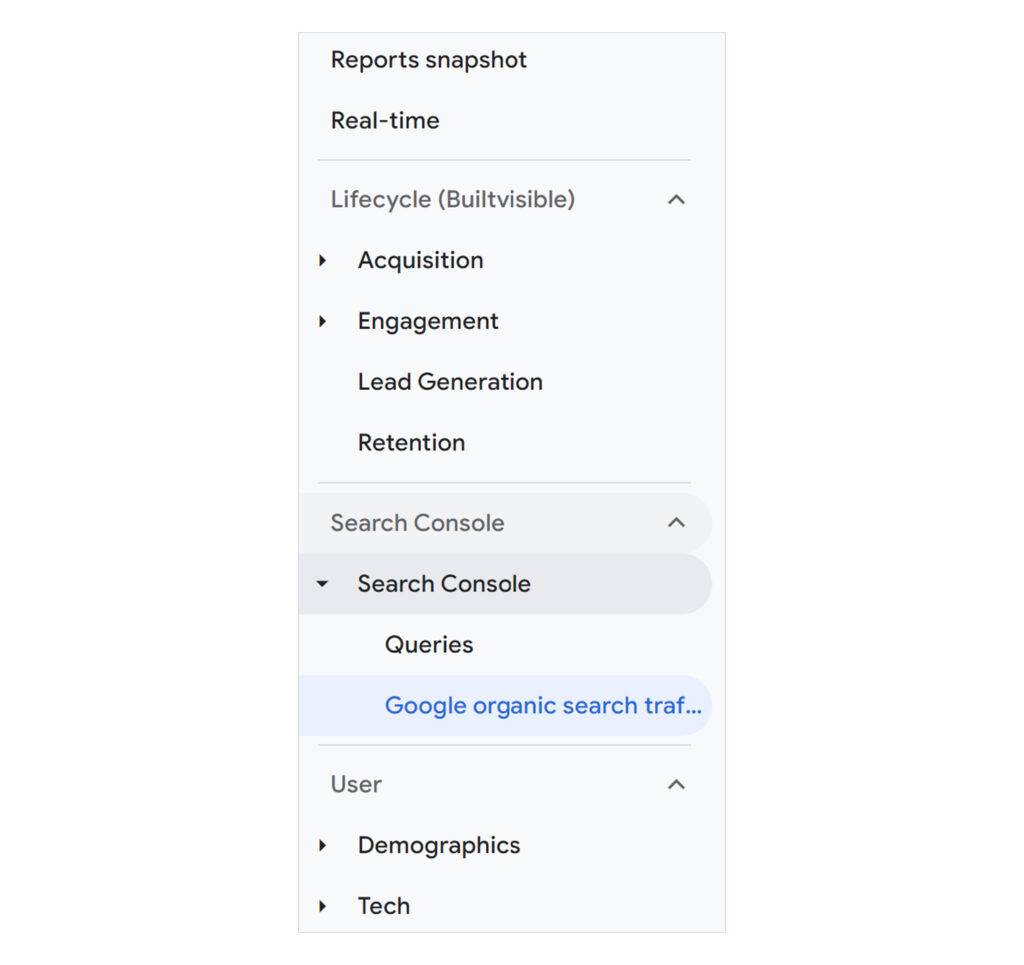
These reports display SEO-specific metrics such as:
- Organic Google search clicks
- Organic Google search impressions
- Organic Google search click through rate
- Organic Google search average position.
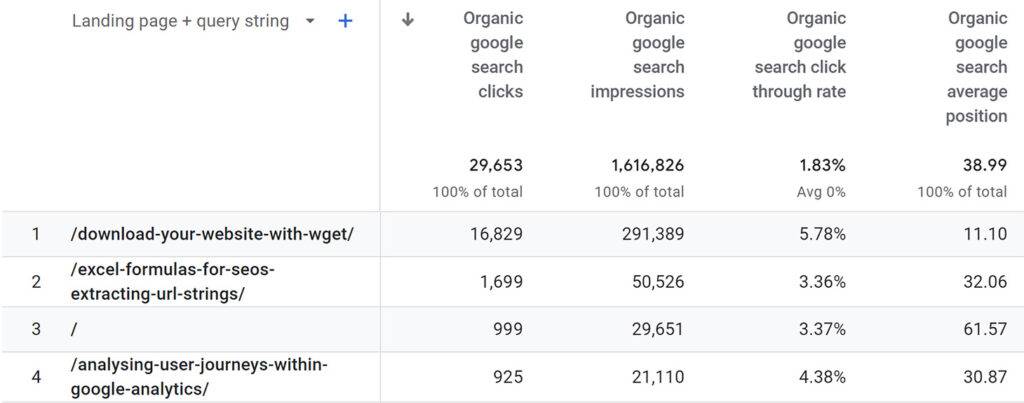
You can view these against the landing page or search query, depending on the chosen report. This is useful in giving you an overview of your top-line metrics and performance. Also, you can have a great snapshot view of your GSC data and analyse your GA4 data all in one place!
Recognise Patterns and Trends
Contextualise patterns
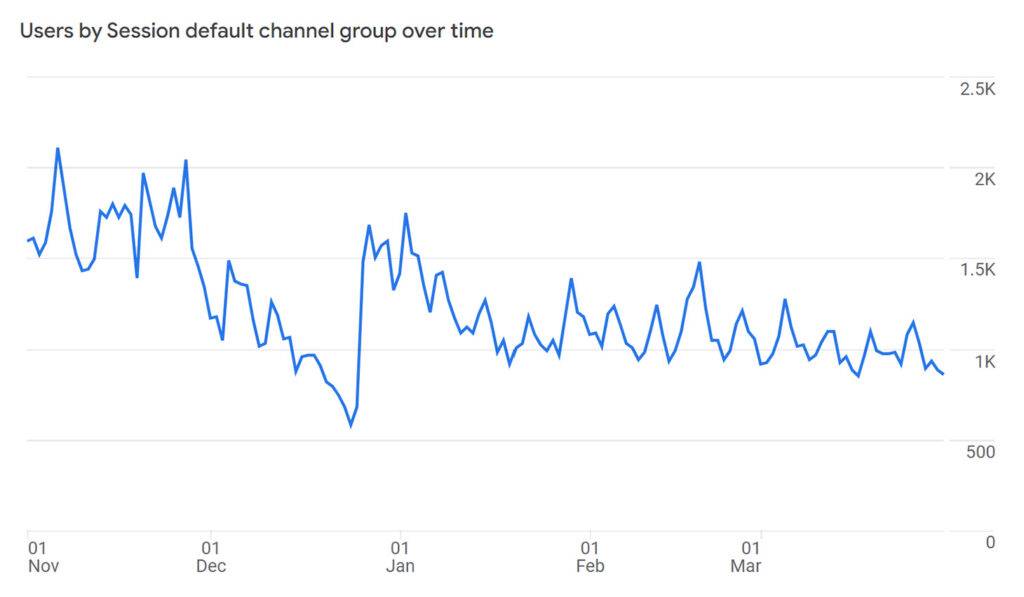
An important factor to consider when analysing site traffic is seasonality and trends. Seasonality refers to the regular patterns of behaviour that occur during specific seasons such as a holiday or calendar season. Trends refer to the overall patterns of behaviour that increase/decrease occur over time. Looking at both can explain any oddities in your data. For example, seasonality can explain a high position for a landing page/query but a drop in traffic.
The line graphs in the standard GA4 reports can help you visualise these seasonal patterns and trends. They allow you to see if there’s a consistent increase, decrease, spike or drop in the data within a set period, making it easier to spot any patterns or trends in user behaviour.
Large data set analysis with BigQuery
By connecting your GA4 to BigQuery, you can perform advanced analysis and gain deeper insights into your SEO data. With the warehouse capability of BigQuery, you can have access to and store a much larger set of data, which is key in identifying those patterns and trends.
Currently, GA4 only displays data from the moment you first set up tracking. It also has a maximum of a 14-month user and event data retention period. Therefore, historical data prior to that point won’t be available in your GA4 property.

With BigQuery, you have access to all of your raw data. So you’ll be able to choose a bigger period of time to investigate your web traffic trends, giving you a clearer picture of any patterns that occur. Not only that, but by exporting data from GA4 to BigQuery, it’s possible to use SQL queries to perform more advanced analysis and create custom segments. This will help further discover patterns that may not be immediately obvious in the GA4 interface so you can make more informed decisions about your SEO efforts.
Final Thoughts…
As you can see, GA4 contains great features which many SEO specialists can benefit from using to determine their site performance. That being said, it shouldn’t be the only platform you use. – it should complement and be used alongside your other main SEO tools. By doing so, you can perform a more holistical analysis.
If you need any help with understanding and improving your SEO or how to use the GA4 interface to support your work, get in touch with our team of experts.
