Make the most of the GA4 Explorations
Looking for more insights compared to the standardised GA4 reports? The Explore module includes a number of reporting tools to help you dive deeper into your data. Plus, you can produce your very own personalised analytics environment. The variety of tools invites you to create custom funnels, segment overlap analysis and user lifetime analysis, which can assist you in your marketing decisions.
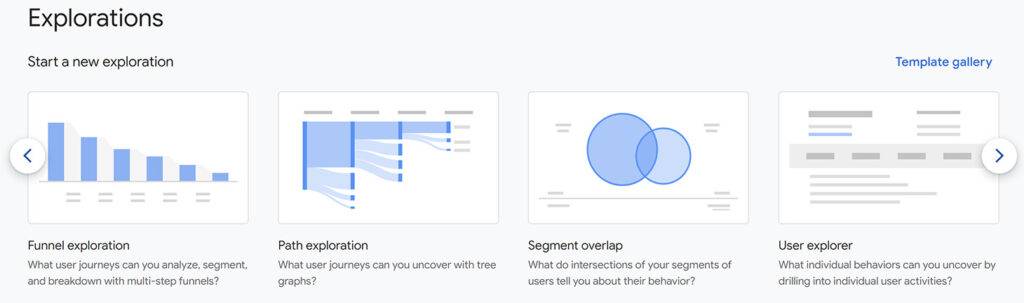
Explore Funnels to view your user site journey
Whether you have a smooth or inconsistent user journey that requires attention, Funnels help you visualise your web users’ navigation path in completing your set goals. Some common examples of goals are Form submissions and product purchases. Being able to see the path your users take on site, helps you pinpoint what’s working well and what needs to be looked into in order to improve the users’ site experience.
Create Segment overlaps to understand your target audience
Another feature is the Segment overlap report template which equips you with the resources to create audiences. These can overlap with other audiences, enabling you to identify the mutual point of interest between two cohorts. This is useful to get a better insight into the individual audiences and in turn, enhance your remarketing strategy.
Make user lifetime reports to gain user insights
Additionally, the User Lifetime report presents you with data around your web customers’ behaviour during their lifetime. This report can show you where your highest lifetime value customers in any chosen audience were recruited from, their average lifetime transactions, alongside many other metrics to incorporate.

These are just a few of the features accessible in the Explore module that will aid you in generating a much more developed GA4 dashboard. Even though these features exist, struggles often arise in pulling together a well presented set of reports when faced with a new platform or an interface you’re unfamiliar with. This is where Looker Studio (formerly known as Google Data Studio) comes in handy, helping to facilitate these processes.
What Looker Studio has to offer
Visually appealing reports
To start with, one of the benefits of using GA4 data alongside Looker Studio is the ability to create visually appealing and familiar reports with greater ease. Reports such as the sales funnel report that are no longer available within GA4, are replicable using Looker Studio’s recognisable tools and interface. In addition, the various reporting templates in Looker Studio are a valuable asset in speeding up your dashboard creation, making the process much smoother. The numerous style features also give you the freedom to design your dashboard in whatever way you please, giving you more creative leeway to make your mark on each one.
Incorporate new GA4 metrics into reporting
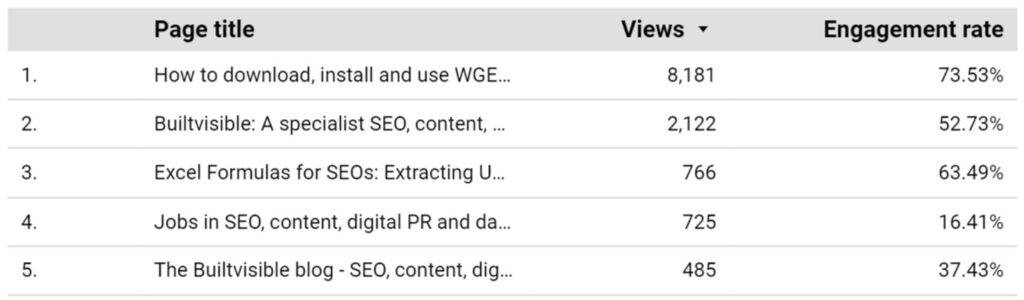
Trying to find some of the new GA4 metrics can be tricky, especially when you’re not sure where to look. GA4 has introduced a new metric called Engagement, measuring the amount of time users spend on landing pages, helping to provide a more accurate picture of user behaviour. However, as this metric isn’t displayed in the set reports, it’s difficult to find it in GA4. This is a similar case with the bounce rate metric which didn’t exist in the first launch of GA4, but upon revision was reintroduced to the platform in July 2022 (with a change in definition to what appeared in Universal Analytics.) Looker Studio has made finding and incorporating these metrics into your reports much easier.
Quicker report loading time
GA4s new and sturdier connector to Looker Studio means that the time it takes to render Looker Studio reports through GA4 has significantly reduced. So the creation and display of custom graphs and charts in Looker Studio takes much less time in GA4 versus Universal Analytics, becoming more efficient.
All these different functionalities become available when you combine Looker Studio with GA4, so go on and link the two together and get ready to showcase your data in an appealing and practical way.
Reporting Limitations
Turnaround to segmentation within GA4
On the other hand, as GA4 does still face some reporting limitations, some of those can’t be addressed yet by Looker Studio. For instance, GA4 does not have segmentation options in the property, which means they are also unavailable in Looker Studio. Audiences in GA4, which determine the conditions to filter users, have now replaced segments. However, this feature isn’t accessible in Looker Studio as it’s exclusive to GA4, so you won’t be able to define a segment or audience in a custom Looker Studio report, potentially hindering your ability to generate a more comprehensive report.
Restricted Data control option
Also, GA4 does not allow you to use a data control option for Google Analytics properties. A data control option is when you are able to select the account, property and view that supplies data to Looker Studio reports. This makes it easy to share reports with collaborators and colleagues who would want to use the reports with different data sources. So, not having this option makes this a tough process.
Overcoming Reporting Limitations
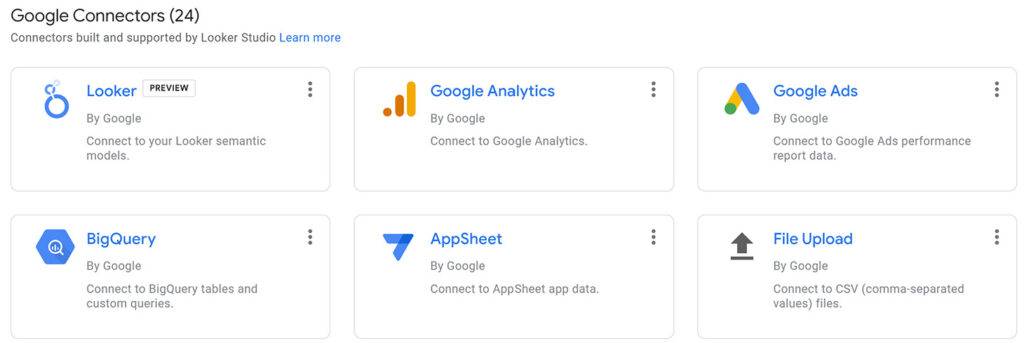
Cost-free BigQuery connection to GA4
But do not fear as BigQuery is here. Linking together your GA4 and Looker Studio with BigQuery can help you address the above limitations. While in Universal Analytics this connection was only free for 360 customers, it’s now free for all GA4 users! You are charged only for the amount of data that is stored and processed, so the first 10GB of data stored and the first 1TB of data queried is free and after that, there is a low monthly cost.
Access all your raw GA4 data
One of the biggest benefits of enabling BigQuery is that it allows you to access all of your raw GA data, and by running SQL queries, you can make advanced data manipulations and segmentations possible. This is one of the biggest limitations in using GA4 and Looker Studio alone. With Looker Studio offering SQL queries in BigQuery as a blended data source, you can combine all three platforms together to optimise your data dashboards and gain more in-depth insights.
Instant data error modification
Not only that, but with the help of BigQuery, you are able to easily modify any incorrect data within your reporting. This is something GA4 does not allow you to do. Without this, there is a potential risk of having inaccurate and unreliable data reporting which cannot be fixed.
Analyse historical data within seconds
Also, GA4 only displays data from the moment you first set up tracking. Historical data prior to that point is not available in your GA4 property. Connecting BigQuery will enable you to analyse and report on all historical data and query large data sets within seconds. As a result, your data analysis process will become much more cohesive and smooth.
Export GA4 reports to Google Sheets efficiently
Another main point of concern for many marketers has been the lack of a direct GA4 to Google Sheets integration. This renders the process of getting your GA4 data into a Google Sheets report excessively manual and inefficient. Here is where BigQuery is a great help. After linking the two platforms, you can pull raw GA4 data into BigQuery and set up an automated process of exporting your SQL queries into Google Sheets reports using the Connected Sheets feature. This is a major time-saver in getting your GA4 to Google Sheets reports.
Using BigQuery can seem quite complex and requires knowledge of the programming language SQL to make queries and analysis. For this reason, we recommend getting help from specialists who can produce advanced analysis on BigQuery and utilise all three platforms of GA4, Looker Studio and BigQuery to deliver you a valuable and dynamic reporting dashboard.
With so many changes to how we report in GA4, it may be a bit daunting at first. But as you can see, it’s a lot less complex than it first seems and offers a lot more choice – so you can choose the reporting option that best suits your needs.
If reporting on your GA4 data is still a mystery, our GA4 and Looker Studio experts are on hand to help. Get in touch here to find out how we can help you.