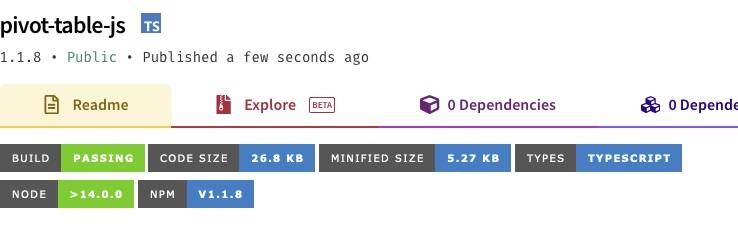
What is pivot-table-js?
Available on NPM, pivot-table-js is a lightweight module that closely replicates the functionality of Excel and Google Sheets pivot tables.
Used heavily in our internal suite of bespoke web apps that power our internal workflows, pivot-table-js allows you to apply aggregations to sets of values.
Feed-in an array of objects, specify the index and desired functions and generate a new array of objects containing your aggregations.
How to use pivot-table-js
To use pivot-table-js, first make sure you’ve installed Node.js and then add the npm pivot-table-js package:
npm i pivot-table-js
import { Pivot } from 'pivot-table-js'
If you have used Node.js before to run scripts, then the readme file should be all you need.
If not, read below for a step-by-step run-through of how to use the module to import and manipulate a dataset for SEO analysis.
Project set up
To begin using pivot-table-js, we first need to import our data. In this instance, a SEMrush rank export from a random ecommerce brand.
When working in JavaScript, we want to be using JSON as a data format. So the first step is creating a project and converting our CSV file to JSON.
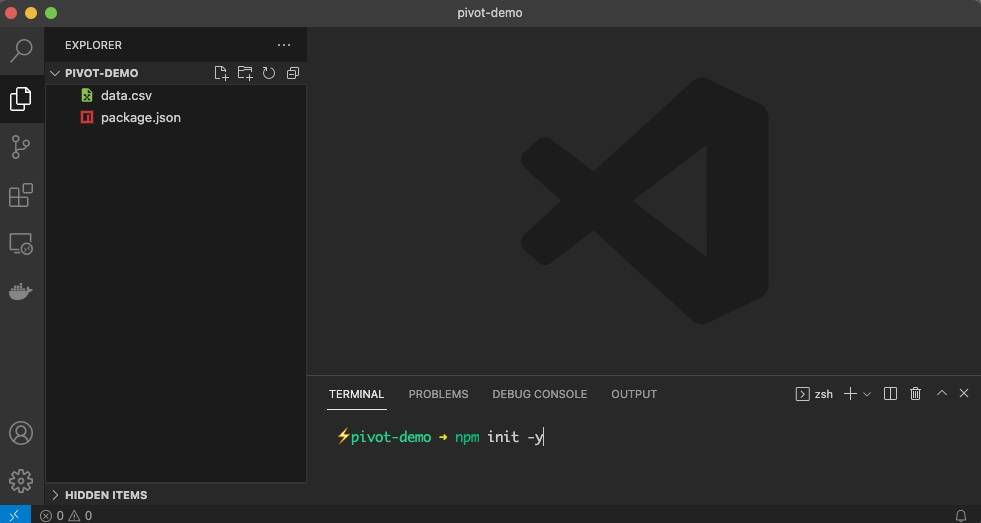
To begin, load up your IDE of choice (we recommend Visual Studio Code because of its integrated terminal) and create a folder named pivot-demo. Move in the data.csv file and start the Node.js project by running the init command with the “yes” flag to set up default parameters:
npm init -y
Next, install the package by typing:
npm i pivot-table-js
To handle the conversion of the CSV file to JSON, we’re going to use the lightweight csv-parser package. It’s also important to make sure that the CSV data is not corrupted by a byte order mark (BOM), so we’ll also install the package strip-bom-stream to deal with that:
npm i csv-parser strip-bom-stream
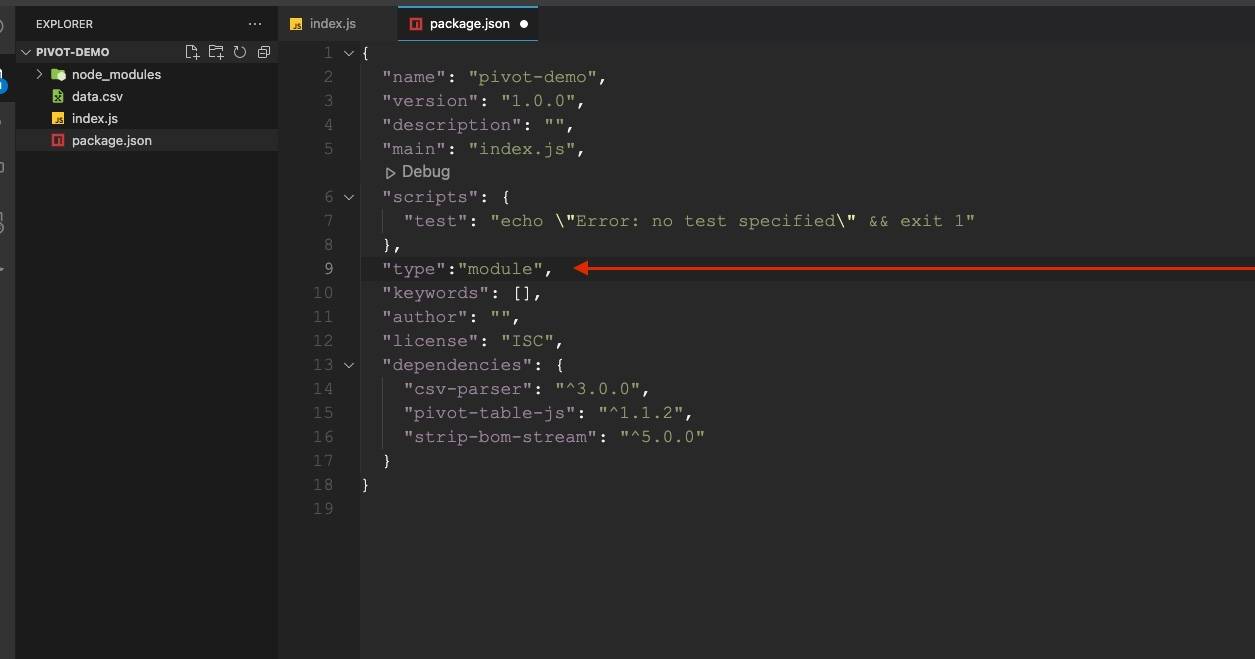
Our node_modules folder has now been generated with everything we need.
Before we start coding, let’s enable the ES modules feature in Node so we can more easily import dependencies. To do this, we need to add an entry in our package.json file:
"type": "module"
We can now create an index.js file and declare all of our required dependencies using the import declaration:
// Module to convert CSV to JSON
import csv from 'csv-parser';

// Module to strip BOM from csv in case it has it
import stripBom from 'strip-bom-stream';

// Module to read a file
import { createReadStream } from 'fs';

// Module to use pivot tables
import { Pivot } from 'pivot-table-js';
And create a function to convert the csv to JSON and remove the BOM:
// Take a CSV file, remove BOM if present and convert to JSON
const convertToJSON = async (file) => {
  return new Promise((resolve, reject) => {
    const json = [;

    createReadStream(file)
      .pipe(stripBom())
      .pipe(csv())
      .on('error', (err) => reject(err))
      .on('data', (data) => json.push(data))
      .on('end', () => resolve(json))
  });
};
Next, let’s create an immediately invoked function expression (IIFE) to call our data and process it with pivot-table-js:
// Module to convert CSV to JSON
import csv from 'csv-parser';

// Module to strip BOM from csv in case it has it
import stripBom from 'strip-bom-stream';

// Module to read a file
import { createReadStream } from 'fs';

// Module to use pivot tables
import { Pivot } from 'pivot-table-js';

// Take a CSV file, remove BOM if present and convert to JSON
const convertToJSON = async (file) => {
  return new Promise((resolve, reject) => {
    const json = [];

    createReadStream(file)
      .pipe(stripBom())
      .pipe(csv())
      .on('error', (err) => reject(err))
      .on('data', (data) => json.push(data))
      .on('end', () => resolve(json));
  });
};

// IIFE ready to run pivot-table-js
(async () => {
  // Capture the data, provide file name
  const data = await convertToJSON('data.csv');
})();
Manipulating the data
With the project set up, we can now start using our module to manipulate our dataset, which contains the following structure:
{
  'Keyword': 'petts at home',
  'Position': '1',
  'Previous position': '1',
  'Search Volume': '140',
  'CPC': '0.22',
  'URL': 'https://www.petsathome.com/',
  'Traffic': '112',
  'Traffic (%)': '0',
  'Traffic Cost': '24',
  'Keyword Intents': 'navigational'
}
With this data, we are going to use:
- URL as our pivot index
- Keyword with the aggregate function of count
- Search Volume with the aggregate function of sum
- Traffic with the aggregate function of sum
To do this, we’ll declare our index as a string and the aggregate functions as an object:
// Set index to pivot
const index = 'URL';

// Declare your aggregate functions
const aggFunc = {
  'Keyword': 'count',
  'Search Volume': 'sum',
  'Traffic': 'sum'
};
And then we put it all together by calling the Pivot function and setting the data array as our first parameter:
// Pivot function with the three required parameters
const result = Pivot(data, index, aggFunc);
The output
Our finished index.js file will look like this:
import csv from 'csv-parser';
import { createReadStream } from 'fs';
import stripBom from 'strip-bom-stream';
import { Pivot } from 'pivot-table-js';

const convertToJSON = async (file) => {
  return new Promise((resolve, reject) => {
    const json = []

    createReadStream(file)
      .pipe(stripBom())
      .pipe(csv())
      .on('error', (err) => reject(err))
      .on('data', (data) => json.push(data))
      .on('end', () => resolve(json))
  });
};

(async () => {
  const data = await convertToJSON('data.csv');
  const index = 'URL';
  const aggFunc = {
    'Keyword': 'count',
    'Search Volume': 'sum',
    'Traffic': 'sum'
  };

  const result = Pivot(data, index, aggFunc);
  console.log(result);
})();
This will output the pivots in the following structure:
 [{
    URL: 'https://community.petsathome.com/groom-room/abingdon/',
    'Count of Keyword': 1,
    'Sum of Search Volume': 260,
    'Sum of Traffic': 208
  },
  {
    URL: 'https://community.petsathome.com/groom-room/accrington/',
    'Count of Keyword': 2,
    'Sum of Search Volume': 280,
    'Sum of Traffic': 150
  },
  {
    URL: 'https://community.petsathome.com/groom-room/aintree/',
    'Count of Keyword': 1,
    'Sum of Search Volume': 70,
    'Sum of Traffic': 17
  },
  {
    URL: 'https://community.petsathome.com/groom-room/alnwick/',
    'Count of Keyword': 1,
    'Sum of Search Volume': 480,
    'Sum of Traffic': 12
  },
  {
    URL: 'https://community.petsathome.com/groom-room/alsager/',
    'Count of Keyword': 2,
    'Sum of Search Volume': 830,
    'Sum of Traffic': 147
  }...
Further options
Custom headers
When you don’t include an array as the last parameter, the headers will be automatically renamed based on the selected functions.
If you want to make the output more meaningful, you can make use of the optional array and output custom headers with your preferred names:
const rename = ['URL', 'Keywords', 'Search Vol', 'Traffic Total'];

Pivot(data, index, aggFunc, rename);
Giving you the desired output:
[{
    'URL': 'https://community.petsathome.com/groom-room/colne/',
    'Keywords': 3,
    'Search Vol': 1040,
    'Traffic Total': 89
  },
  {
    'URL': 'https://community.petsathome.com/groom-room/colton/',
    'Keywords': 3,
    'Search Vol': 710,
    'Traffic Total': 405
  },
  {
    'URL': 'https://community.petsathome.com/groom-room/consett/',
    'Keywords': 4,
    'Search Vol': 1500,
    'Traffic Total': 146
  },
  ... 4869 more items
Applying multiple functions on the same column
To generate a more complex output, with two or more aggregations on the same column, the functions can be added to an array:
Traffic: ['sum', 'mean']
As an example:
const index = 'Keyword Intents'

const aggFunc = {
  'Keyword': 'count',
  'Search Volume': ['sum', 'mean'],
  'Traffic': ['sum', 'mean'],
  'Position': 'mean'
}

Pivot(data, index, aggFunc, rename);
Will output:
[{
    'Keyword Intents': 'informational, transactional',
    'Count of Keyword': 7329,
    'Sum of Search Volume': 2769970,
    'Mean of Search Volume': 377.947,
    'Sum of Traffic': 646723,
    'Mean of Traffic': 88.242,
    'Mean of Position': 2.083
  },
  {
    'Keyword Intents': 'navigational',
    'Count of Keyword': 852,
    'Sum of Search Volume': 2881840,
    'Mean of Search Volume': 3382.441,
    'Sum of Traffic': 1731344,
    'Mean of Traffic': 2032.094,
    'Mean of Position': 1.984
  },
  {
    'Keyword Intents': 'navigational, transactional',
    'Count of Keyword': 1868,
    'Sum of Search Volume': 611650,
    'Mean of Search Volume': 327.436,
    'Sum of Traffic': 134622,
    'Mean of Traffic': 72.067,
    'Mean of Position': 2.212
  },
...
It’s my hope that both the SEO and wider JS community find this module as useful as I do in my everyday work.
If you have any questions about using the module or want to learn more about how Builtvisible leverage custom applications to maximise our clients’ spend, then please don’t hesitate to get in touch.