Google Lighthouse key features
The standard Lighthouse report provides information on a wide array of factors, in an easily digestible format. Some notable inclusions for website performance are:
- HTTP/2 – Provides a list of every internal resource that was not served over HTTP/2.
- WebP Images – Highlights all of the images that could be served in WebP, Google’s new, open source image format.
- Critical Request Chains – Lists the critical resources that had to be downloaded before the page could be rendered, and the order in which they were requested.
- First Meaningful Paint – The time required to begin rendering content within the browser.
- Time to Interactive – A measure of the point at which a page has loaded enough for a user to interact with it.
- Speed Index – An overall speed scoring, using Speedline, which measures how quickly a page is visibly populated.
Getting started with Google Lighthouse
Lighthouse is available for use as a Chrome extension but needs to open its own browser instance in a new tab. This can be quite annoying if you’re trying to do other things whilst the test runs. Instead, I’d recommend running it as a command line tool, using Node.js.
First off, we’ll need to install the LTS version of Node.js, which can be found on the official website. Once that’s done, load up the Node command prompt and install Lighthouse using the npm package manager with the following command:npm install -g lighthouse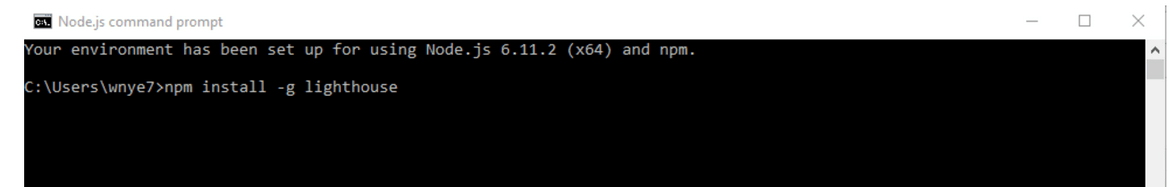
Once this has finished you’re ready to go. Run an audit by inputting:lighthouse [url]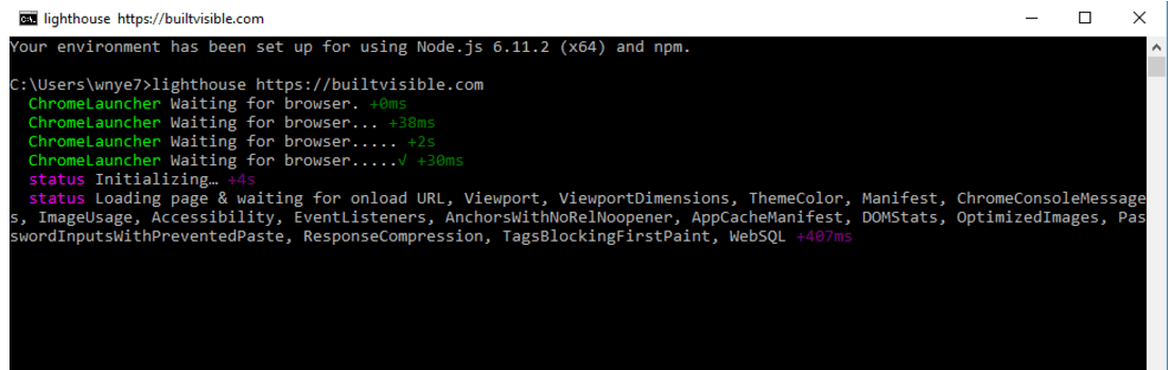
An HTML report will be saved to the directory you’re currently in. This is specified to the left of the blinking cursor within the command prompt, and can be changed by using the cd command.
For a full list of commands type:lighthouse --help
Options include the ability to save reports in JSON, specify a different report name or save screenshots.
Performing batch tests with Lighthouse
Standalone Lighthouse reports have utility by themselves, but for a better view of overall site performance you’ll want to audit multiple page templates. Lighthouse lacks the functionality to batch test out of the box, but the beauty of NPM is that you can usually find a user submitted package to perform a specific task.
In this instance, we can install Lighthouse Batch Reporter. Bring up the Node command prompt again and enter:npm install lighthouse-batch -g
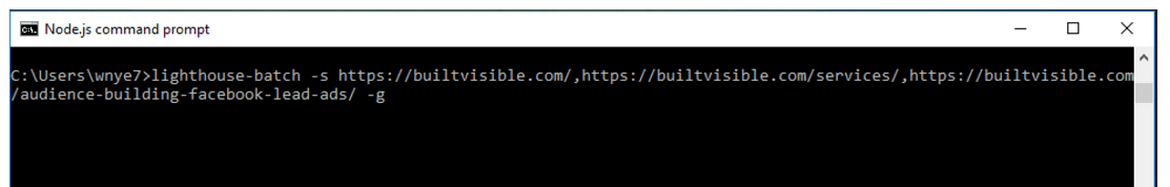
To run an audit enter the following command, using commas to separate the URLs:lighthouse-batch -s ,[url1],[url2],[url3] -g
If you get a runtime error on Windows make sure you’ve added the ‘-g’. This may not be necessary on Mac or Linux, but bear in mind that the commands will be slightly different on a Unix terminal (see the options within the documentation).
The exports will be located at \[your file path]\report\lighthouse\. Add ‘-h’ if you want the report in HTML. It’s also worth noting that running another batch will overwrite the old ones unless you move them or specify a different output folder.
Other packages to explore
Hopefully this post has demonstrated how Lighthouse – and in fact other tools – can help you when analysing webpage performance. But if you want to take things further then there are lots more packages you can explore.
One worth looking at is Pwmetrics, which uses the Lighthouse API but only collects the key performance metrics. This can also be integrated to push the results to Google Sheets, or automatically save Chrome DevTools timeline traces to Google Drive. These can then be shared and compared.
Other interesting options include Phantomas and the more well-known Sitespeed.io, both of which collect a huge range of metrics by leveraging multiple open source tools.

Eduardo Julio
Hey Will thanks for your guide, Im sure a lot of people dont know about Lighthouse and Im not sure if you know about this, but Chrome now comes integrated with Lighthouse in the audits panel.
https://developers.google.com/web/updates/2017/05/devtools-release-notes#lighthouse
Will Nye
Thanks Eduardo,
You’re right this is now in dev tools in Chrome 60+, which is much nicer than the Chrome extension.
Personally I still prefer using the command prompt though, so you can run it on a batch of URLs.