Debugging and Testing
Google Analytics Debugger
This extension was one of the first to be released and is developed by the Google Analytics team. It’s actually very simple: requests for the ‘analytics.js’ library are automatically converted to the ‘analytics_debug.js’ version, meaning that useful messages are printed to the JavaScript console as hits are generated. This enables you to diagnose issues with hit type, custom dimensions, content groupings, and so on.
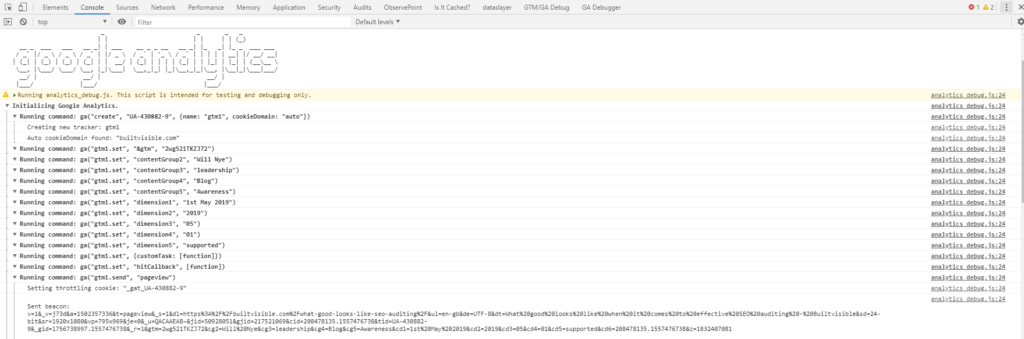
While it’s definitely one to keep installed, I personally don’t use this extension that often. It’s fairly limited in scope, and its reliance on the console makes it less flexible that some of the other tools in this list.
Tag Assistant
Tag Assistant is also developed by Google. This extensions gives us the ability to record an entire sequence of pageviews, meaning that it’s great for testing user journeys and debugging sessions. At the end, your recording is available as a user-friendly report that can be exported.
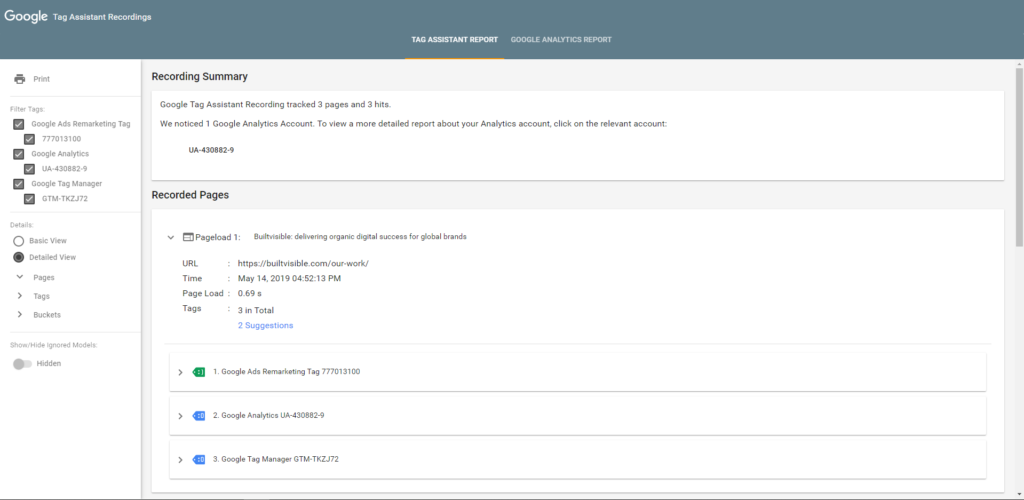
Unlike the Google Analytics Debugger, Tag Assistant also works with GTM and other Google Marketing Tags. Its main downside is that it hasn’t been kept up-to-date – I’ve recently experienced the occasional crash, and its warning messages about non-standard implementations seem to occur at random.
Observepoint Tag Debugger
This is one of my favourite extensions. It’s the one I recommend to anyone wanting to understand tracking in more granular detail. ObservePoint, unlike Google Analytics Debugger, adds its own tab on to the Dev Tools, keeping it tidy and easy to access.
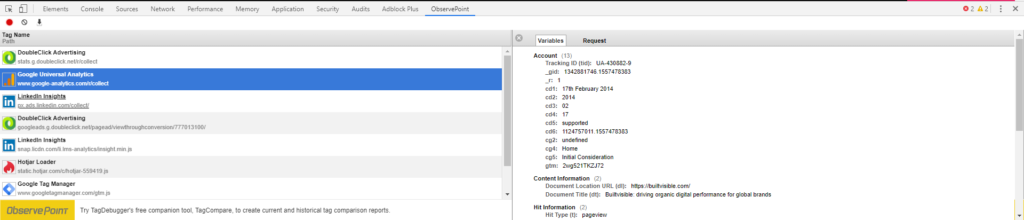
You can click into different tags to get a detailed breakdown of all the variables that are being collected such as Tracking ID, Custom Dimensions and Content Groupings for Google Analytics. The tags are also displayed in real-time, meaning you can test event tracking with ease.
Another feature of ObservePoint is it displays all marketing, advertising and analytics tags. This can be extremely useful to show any rogue tracking on a site but can be messy when you are just trying to debug your GA tracking. Luckily the team have thought about this, with the option to select to only look at specific categories of tags by going to the extension options.
Ghostery
Ghostery has been around for a long time and like ObservePoint is useful for giving an overview of all trackers and tags on a website. The unique feature of Ghostery is the ability to block certain types of tags from firing on your browser, allowing you to become a ghost. I find this useful when testing client’s websites as I can block tags from firing if an IP filter hasn’t been set up yet. The disadvantage of Ghostery is unlike Observepoint it doesn’t give you the ability to look at a tag in detail.

When you see a tag you are unsure about, Ghostery gives you the ability to understand more such as what the company behind it is about, their affiliations and privacy contact.
Tag Manager Injector
This extension is very simple but can be extremely useful. It allows you to inject a GTM container on to any site by adding the GTM container ID.

It comes in useful when you are waiting for GTM to be added to the site, allowing you to start building out the container before GTM is even in place. You can also push a mock data layer allowing you to start creating variables and mapping these into GTM.
General Auditing
In order to make practical recommendations or to accurately scope a project, it’s vital that your understanding of the site extends beyond the surface-level implementation of tracking code. A thorough understanding of a site’s architecture, build, and current performance are immensely valuable. Here I’ve collected some of the more general-purpose extensions that have helped me in this regard.
Whatruns
This is an extension I only discovered recently but has already become one of my favourites. When you visit any website, Whatruns will breakdown (an approximation of) the technology that makes it run.

This is very useful when scoping a website as it gives you a good overview of what makes it tick.
SimilarWeb
SimilarWeb has been around for a long time and the extension is an easy way to get quick insight into a website’s approximate performance. The figures aren’t exact but gives you a estimate of traffic, website ranking, geographic and traffic source breakdown. If you are interested in understanding where this data comes from, give this page by SimilarWeb a read.
Page Analytics
If you are analysing a website and already have access to the Google Analytics property, this extension is a great tool to quickly marry up insights with the page you’re currently looking at.

It displays pageviews, unique pageviews, average time on page, bounce rate and exit rate by default but these can be updated with most page level metrics. There is also the ability to apply segments and even see in real-time how many users are on the site.
One of the unique features of this tool is its ability to show click patterns. Note that this is based entirely on the ‘Page’ dimension of the subsequent hit; if two CTAs have the same destination page as one another, you will see same percentage for each.
Dev Tools
Now I know this isn’t an extension but hear me out! The development tools built into modern browsers are not only incredibly powerful but are frequently updated with new features. These tools are sometimes overlooked by analysts; you might assume that a particular task requires an extension when in fact in can be accomplished with native functionality. Since we are talking about Chrome Extensions, we will stick to looking at the Chrome DevTools, I recommend following Chrome DevTools on Twitter and checking the release notes! Firefox DevTools are also worth checking out and documentation can be found here.
These tools are deserving of a complete guide in their own right, so for now, I’ve just picked a few examples of how I frequently use them.
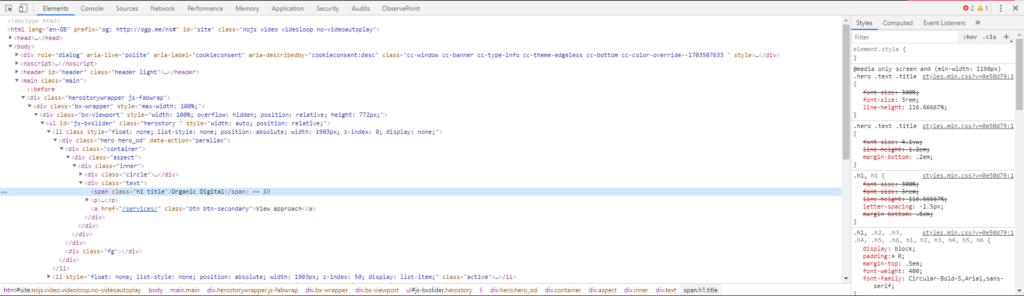
The Elements panel is used to view and change the DOM and CSS. Unlike the raw page source, the elements panel displays the DOM; this means it reflects any changes which have been made with JavaScript. This can be used to check that your custom HTML tags in GTM have been injected correctly.
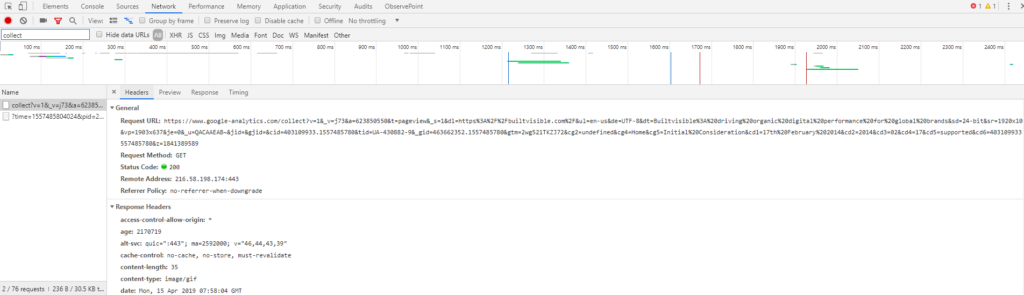
The Network panel lets you view and debug network activity on a page. I commonly use this to monitor requests for specific resources, such as the Universal Analytics tag and look at the variables being set:
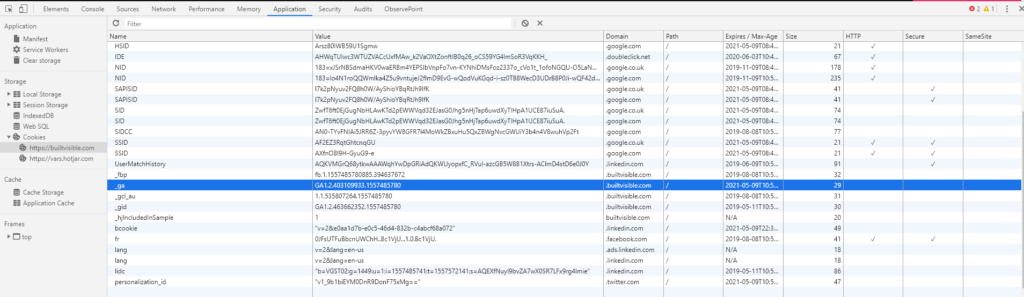
The Application panel is where you can inspect cookies, local and session storage, and service workers. This is how I quickly check the client ID which has been set in the _ga cookie:
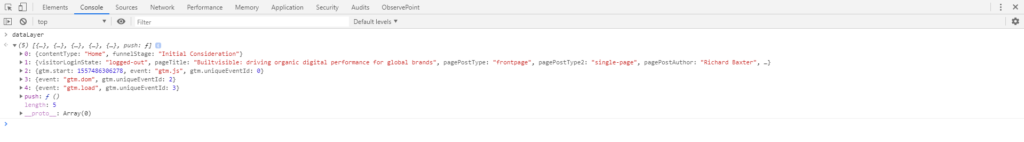
Finally, the Console is where you can run JavaScript and watch for messages logged from your scripts. A common use for analysts is inspecting the Data Layer created by GTM, by which I mean the actual JavaScript array rather than GTM’s own abstracted data model.
If you’re interested in discovering more extensions, check out our post on the 10 best browser extensions for SEOs by our Senior SEO Executive, William Kay.
Hopefully this round-up has helped you discover some new extensions to use. Obviously this isn’t a comprehensive list, so if there are any extension you’d like to recommend, please let me know in the comment section below.

Jean-Christophe Chouinard
Great Post Richard,
Another very useful tool is the Web Developer extension for chrome that lets you activate or deactivate anything in the code in one click only.
I think it would be great if you also talked about built-in functions like the Lighthouse site audit.