We recommend getting started ASAP
Any existing Google Analytics account holders should be setting up a GA4 property today.
The main reason for that is because it is completely new, there’ll be no data in there, and you can’t import any data history or compare it to Universal Analytics data. So, the earliest you start collecting data, the better, because that means you can start building up that data history before Universal Analytics ultimately turns off at some point in the future.
The other factor is that this being the default experience means that Google will no longer be introducing any product updates into Universal Analytics. So, if there is a new feature that they decide to launch, it will be launched into GA4 only, and as a Universal Analytics user you won’t get to benefit from it.
The good news for App+Web properties is that these have been automatically updated to GA4. So, if you already started setting that up and using that, you don’t have to do anything additional.
Moving away from a nested data structure
The data structure, for me, really hammers home just how different and non-comparable this version of GA is going to be. It also highlights the learning curve necessary and the need to get up to speed sooner rather than later.
Universal Analytics had a nested data structure, where you had data within data, within data. You were able to get more and more granular, and it was stored into relative points (or scopes).
On the outer level, we have the user – all activity from a single Client ID or User ID. The Client ID being the auto-generated cookie ID, and the User ID being something curated by the business and set when you log in.
Each of those users can, or hopefully, will have multiple sessions and that is a string of consecutive hits sent from a single user in succession, unless any of the caveats are there:
- >30mins between hits
- >500 hits received
- A new source was detected
- >12 hours in total
There are seven different types of hits that Google have introduced over the years:
- Pageview
- Event
- Transaction
- Exception
- User Timing
- Screen view
- Social
Transactions became a little bit redundant when Enhanced E-commerce was revealed because we don’t really use that structure anymore. If you hadn’t used Enhanced Ecommerce, and were just using standard e-commerce, then the Transaction hit becomes quite important.
Exceptions and User Timing are very interesting things for us analysts and certainly developers as well. You can’t actually see them in the UI at all, so most people don’t even know they exist. You have to use the BigQuery backups to get that.
Screen Views were for app tracking, which was retired when Google bought Firebase, and were equivalent to the Pageview
Social is still available, but I’ve never seen anyone use it. If you use any social sharing buttons, you could send data, which is structured slightly differently, around what it is you’re actually sharing and where you’re sharing it, rather than the content on the site.
With each hit type having its own data structure, this quickly becomes confusing for those using and maintaining the setup alike; this is why most of use Pageviews and Events for everything.
Then, to add further complexity, Enhanced Ecommerce gave us the ability to add product-specific data, such as price and availability, which gives us a whole new level of granularity.
Data was then stored relative to one of those data types, which was known as the data’s scope.
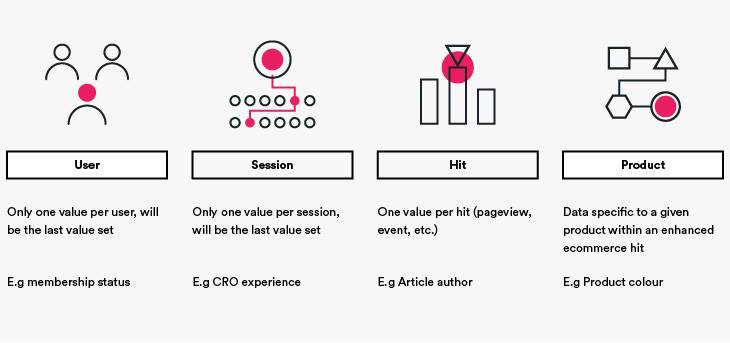
The challenge was that the scope wasn’t immediately obvious, and Analytics users would regularly mix them up in custom reports, leading to confusing and inaccurate results. This is one of the most common usage mistakes we come across.
Key take-away: This was messy, especially for custom built reports but it is far better now!
GA4 has a simplified structure: events and users
We have just two structures of data now: the event and the user. Every single piece of information that you send to GA4 has to be sent as events, there is no other data type – which massively simplifies things!
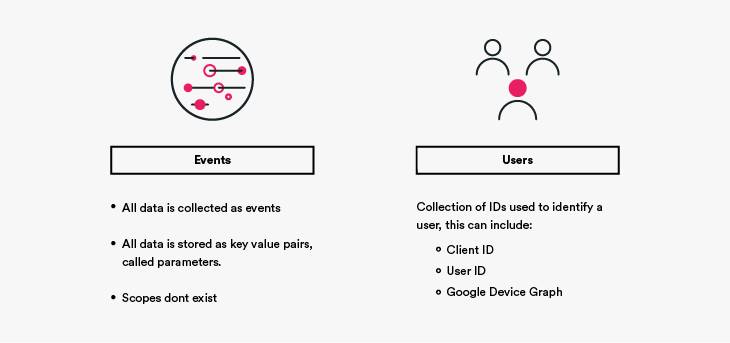
GA4 events are much more flexible than the ones in Universal Analytics. Previously, we had three data points, the category, action, and label, and all data had to fit into one of those or be stored in a custom dimension – of which we had only a few prized slots. Now, all data is stored in key-value pairs called ‘parameters’, and we can have up to 25 parameters per event.
The GA4 tag itself also automates most of the common events for websites, such as pageviews, offsite link clicks, file downloads, scroll depth, and much more! This makes it much simpler to get going, allowing you to focus on the truly meaningful customisations.
Users are still around, but these have also been overhauled in GA4. Device ID (client ID in UA) and User ID are no longer kept entirely separate from each other, instead these are now part of the new Identity Space and are joined by Google Signals data.
When processing data, GA4 defines users based on the User ID (the one you set when the user logs in), then enriches that with Google Signals data, and finally falls back to the Device ID if no other data is available. This provides a seamless and rich cross-device measurement solution – you can opt to go back to the Device ID-only method if you want to, though.
The removal (almost!) of sampling
This is one of the things I get most excited about. The new platform is much more scalable and responsive, meaning the new sampling threshold is so generous as to be nearly non-existent.
Let’s quickly recap on what sampling is and why it’s such a pain; sampling is a method whereby Google would a smaller section of the data, analyse it, and then provide an estimate for the whole data set based upon what had been found. For example, if you were looking at device splits and 25% of the sample was mobile then Google would assume that 25% of the total data was mobile.
But what if that sample was under-indexed, and you actually have closer to 50% of traffic from mobile? Simple: the report would be wrong. The lower the sample used, the more likely this is to happen, and this has been one of the biggest challenges with using Google Analytics at scale.

While GA4 hasn’t killed off sampling entirely, it the threshold to reach is much higher and this means larger businesses should find they encounter this challenge less frequently.
So, to highlight how much better sampling is in GA4, Universal Analytics would start to sample if the property contained more than 500,000 sessions for the data range you are reporting on. I stress the word property there because it doesn’t matter whether the data wouldn’t be included in the report, or if the data was filtered out of the view you’re using – if you collected it, it counts. In GA4, sampling kicks in you need to query more than 10 million events – as we looked at earlier, that’s the equivalent of a whole month’s data collection quota in Universal Analytics!!
But what if you regularly need to query more than 10 million hits? Simple: Free BigQuery exports. This used to be an Analytics 360 feature, but Google have now made this available to every GA4 property, which is huge; not only does it mean there’s always a way of accessing unsampled data, but it also opens up a wealth of advanced analysis options including BigQuery’s native machine learning capabilities!
I do need to highlight that, while the exports themselves are free, there is a cost to using BigQuery, which will depend on how much data you are storing and how much of it you query. But these costs are remarkably low. At time of writing, the query cost was $6.25 per terabyte and storage a low $0.023 per gigabyte, based on a London-based data centre. Added to which, the first terabyte of querying and ten gigabytes of storage are free!
You can check the current pricing here
Google Signals as the default reporting identity
Google Signals was originally announced back in July 2018 and is a Google product designed to provide cross-device capabilities based on Google’s device graph data.
In Universal Analytics, this feature has been used to provide two interesting but fairly limited betas:
- Store Visits: Reports showing the estimated impact of online browsing on physical store visits for multi-channel retail.
- Cross Device: Reports showing how users interact with your site across multiple devices.
In GA4, Signals is now its core part of identity management. By default ‘users’ will now be defined by blending Signals data with Client ID and User ID data into a new Identity Space.
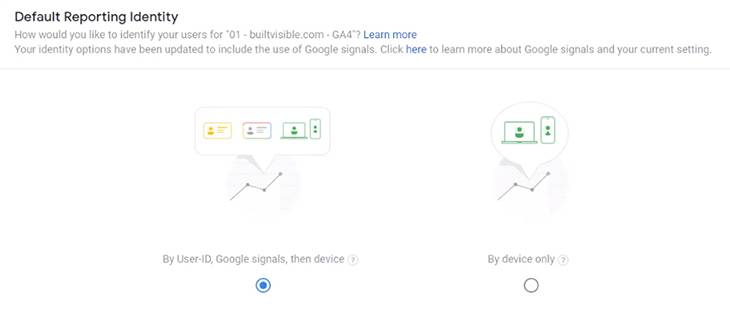
In fact, as you can see in the image above, Google Signals is actually the primary non-managed ID; the user is identified by a managed User ID (which you can set if they log in), if that’s not available Google Signals will be used, if no Signals data exists GA4 will fall back to the Device ID (this is the cookie-stored client ID for websites).
This should mean that user identification is much more robust, allowing for a more seamless cross-device identification solution which is less impacted by ITP, while remaining privacy conscious.
Huge improvements to Custom Dimensions
While Google Analytics collects lots of useful data out of the box, and this even more true of GA4, the real value of any analytics platform comes with adding data specific to your business, which is why the greater scalability and flexibility GA4 provides us here is so exciting.
In Universal Analytic, a free account had 20 custom dimension slots (non-numerical data) and 20 custom metric slots (numerical data). These could very quickly get used by competing requirement on different parts of the website.
For example, you may collect a lot of custom data about your blog post, such as author and publication date, but also need to collect a lot of custom data about your products or services, such as colour or availability.
In GA4, all custom data is stored in parameters which can be any combination of numerical and non-numerical data. The collection limit on parameters is 25 per event!
For data that non-analysts need to access all of the time inside GA4, you can choose some of these parameters to being custom dimensions and metrics – just like you had in Universal Analytics. The quota for these has been increased to 25 user-scoped dimensions, 50 event-scoped dimensions, and 50 custom metrics.
Because you’re defining all custom dimensions based on parameters, the setup is now much easier; you can just start passing any new data into a parameter straight away, without first setting it up inside GA.
And if that isn’t enough to get you excited, you can now collect floating point values and format custom metrics as distances using either imperial or metric measurements; in Universal Analytics we could use integers, currency, or time.
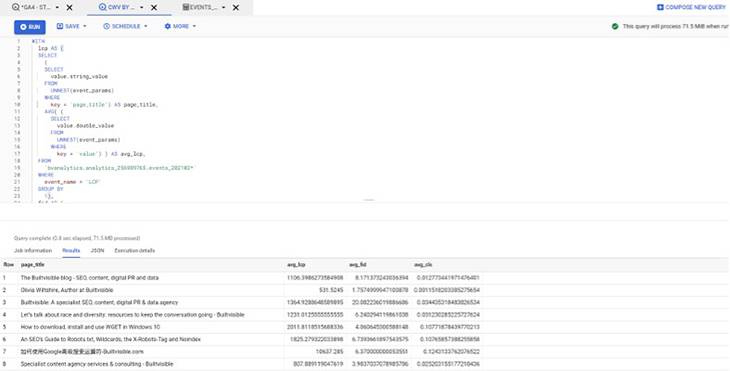
Let’s put all of that together. Below is a report created in BigQuery looking at how pages on builtvisible.com perform for Core Web Vitals, which I couldn’t create in Universal Analytics.
Analysis Hub
In Universal Analytics, our data is neatly bundled into pre-defined reports, but they are very inflexible. In GA4, we have some simple overview reports, which enable us to explore our data and provide us with AI-driven insights. We can then build our own, flexible analyses in the new Analytics Hub.
This is a big paradigm shift from the current situation of curated reports and custom reports; essentially we have some summary stats and a big blank canvas on day one. But once you get familiar with Analysis Hub, you won’t want to go back.

What Analysis Hub gives us over Universal Analytics Custom Reporting is a huge degree of flexibility and some additional functionality, and it’s the latter that I’m going to focus on here; the two that I’m particularly excited about are Funnel Analysis and Path Analysis – opening up what were previously 360 features.
Introducing funnel analysis
Funnel Analysis allows you to specify a custom path through your website, including any combination of events you’re tracking, and see how users move along this path – or not! Unlike goal funnels, these can be applied retrospectively, so you no longer need to identify the important funnels on your site in advance!
This is very similar to the Custom Funnels report within Universal Analytics, except those were only available to Analytics 360 customers. Opening this up to everyone is great, because it’s one of the questions I get asked the most and now I can answer it without creating lots of sequential segments!
Customising path analysis
You may ask, “Isn’t this just the behavior flow?” and the answer is, pretty much. But what’s really exciting about this is that it’s heavily customisable and, potentially, unsampled.
In Universal Analytics, you could see how users moved through pages and events on your website and apply custom segments. In GA4, you can also apply various breakdowns and filters, which allows greater control and granularity over the analysis.
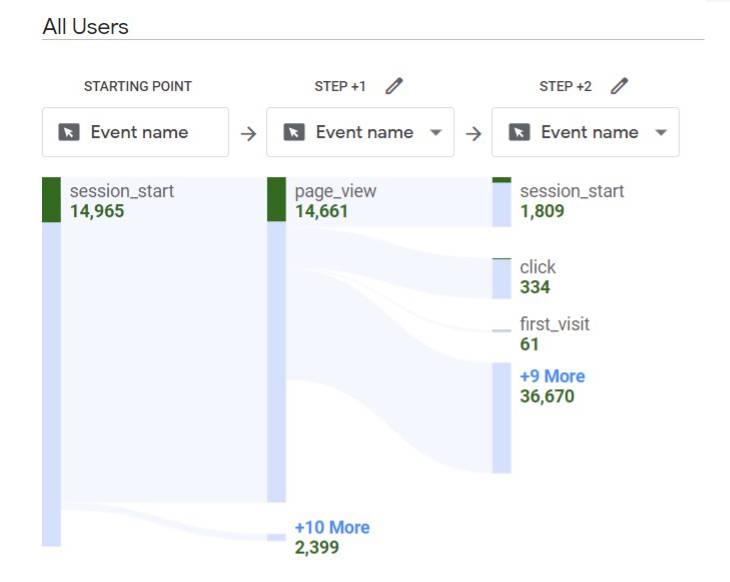
Behaviour flow reports were often quite heavily sampled, I personally find I hit sampling when looking across more than a single week for most clients. In GA4, the Path Analysis comes with the same sampling threshold as any other analysis, giving much greater accuracy.
Learning more about GA4
We’re very excited about GA4, and I’m sure you are too! We’ll be sharing much more content on what can be achieved using the new platform but, if you simply can’t wait, here are some resources to help you get started.
Google help articles have been helpfully prefixed with GA4 in square brackets so it’s nice and easy to have a look and search for GA4-specific content within those. As ever, I’d recommend these as a go-to if there’s a specific question you’re trying to get answered.
There’s also a skill shop course which will guide you through the key learning points via video tutorials. We’re still waiting for an in-depth course similar to the GA IQ, but I’m sure we’ll be seeing one in the coming months.
And, finally, the Google Analytics YouTube channel is fast becoming a treasure trove of handy tips and tricks, as Google continue to hype the new chapter for Analytics. Definitely check it out for inspiration as well how-tos.
As you can see, it is very different, and it will come with a fair amount of new learning requirements. Myself and my data team at Builtvisible are arming ourselves with the latest knowledge to help our clients with the transition so please do reach out if you have any questions as you start to work with GA4.