Moving away from a nested data structure
The data structure, for me, really hammers home just how different and non-comparable this new version of GA is. It also highlights the learning curve that lies ahead and the need to get up to speed sooner rather than later.
Universal Analytics had a nested data structure, where you had data within data, within data. You were able to get more and more granular, and it was stored into relative points (or scopes).
On the outer level, we have the user – all activity from a single Client ID or User ID, the Client ID being the auto-generated cookie ID, and the User ID being something curated by the business and set when you log in.
Each of those users can have multiple sessions, which are a string of consecutive hits sent from a single user in succession, unless any of the caveats are there:
- >30mins between hits
- >500 hits received
- A new source was detected
- >12 hours in total
There are seven different types of hits that Google have introduced over the years:
- Pageview
- Event
- Transaction
- Exception
- User Timing
- Screen view
- Social
Each of these hits has its own data structure and therefore different utilities.
Transactions became a little bit redundant when Enhanced Ecommerce was revealed because analysts don’t really use that structure anymore. But, if you hadn’t used Enhanced Ecommerce, and were instead just using standard e-commerce, then the Transaction hit becomes quite important.
Exceptions and User Timing are very interesting things for us analysts and certainly developers as well. You can’t actually see them in the UI, so most people don’t even know they exist – you have to use the BigQuery backups to get that.
Screen Views were for app tracking, which was retired when Google bought Firebase, and were equivalent to the Pageview.
Social is still available, but I’ve never seen anyone use it. If you use any social sharing buttons, you could send data, which is structured slightly differently, around what it is you’re actually sharing and where you’re sharing it, rather than the content on the site.
With each hit type having its own data structure, this quickly becomes confusing for those both using and maintaining the setup; this is why most people use Pageviews and Events for everything.
Then, to add further complexity, Enhanced Ecommerce gave us the ability to add product-specific data, such as price and availability. This added a whole new level of granularity.
Data was then stored relative to one of those data types, which was known as the data’s scope:
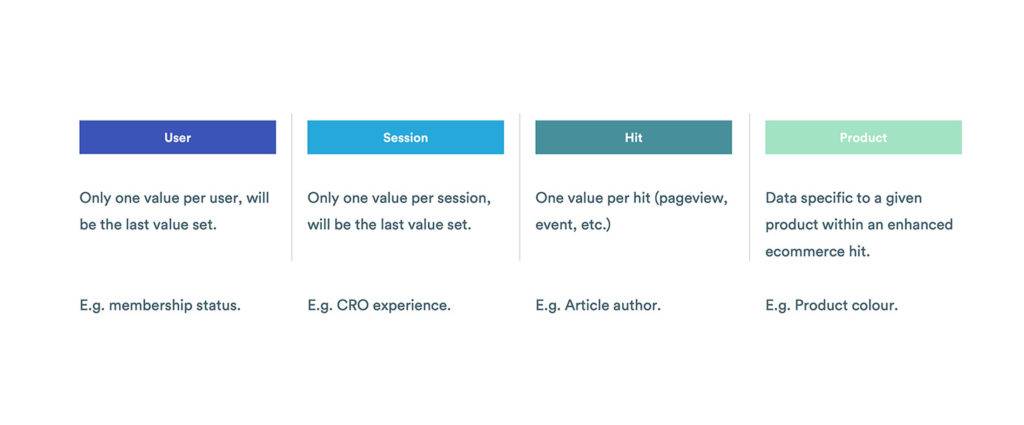
The challenge was that the scope wasn’t immediately obvious and Analytics users would regularly mix them up in custom reports, leading to confusing and inaccurate results. This is one of the most common usage mistakes we come across in GA.
Key take-away:
Nested data was messy, especially for custom built reports. Thankfully, things are far better now!
GA4 has a simplified structure: events and users
With GA4, we now have just two structures of data: the event and the user. Every single piece of information that you send to GA4 has to be sent as events – there is no other data type – which massively simplifies things!
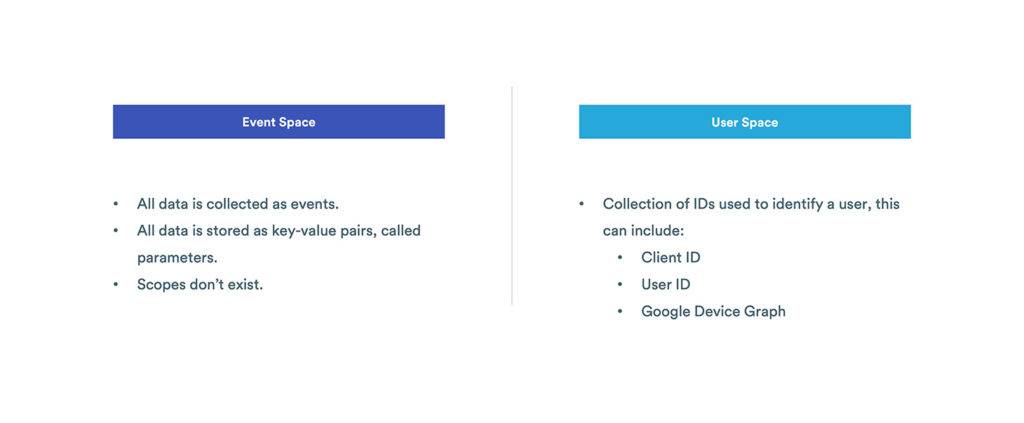
GA4 events are also much more flexible than the ones in Universal Analytics. Previously, we had three data points, the category, action, and label, and all data had to fit into one of those or be stored in a custom dimension (of which we had only a few prized slots). Now, all data is stored in key-value pairs called ‘parameters’. We can have up to 25 parameters per event.
Additionally, the GA4 tag itself automates most of the common events for websites, such as pageviews, offsite link clicks, file downloads, scroll depth, and much more! This makes it simpler to get going, allowing you to focus on building the truly meaningful customisations.
Users are still around, but these have also been overhauled in GA4. Device ID (client ID in UA) & User ID are no longer kept separate from each other. Instead these are now part of the new Identity Space and are joined by Google Signals data (we’ll talk more about this later).
When processing data, GA4 defines users based on the User ID (the one you set when the user logs in), then enriches that with Google Signals data, and finally falls back to the Device ID if no other data is available. This provides a seamless and rich cross-device measurement solution.
Key takeaway:
GA4’s simpler, event-driven data model means easier, more flexible tracking
Improved user definitions powered by Google Signals
Google Signals was originally announced back in July 2018 and is a Google product designed to provide cross-device capabilities based on Google’s device graph data.
In Universal Analytics, this feature provided two interesting but fairly limited betas:
- Store Visits: Reports showing the estimated impact of online browsing on physical store visits for multi-channel retail.
- Cross Device: Reports showing how users interact with your site across multiple devices.
In GA4, Signals is now a core part of identity management. By default, ‘users’ will now be defined by blending Signals data with Client ID and User ID data in a new Identity Space.
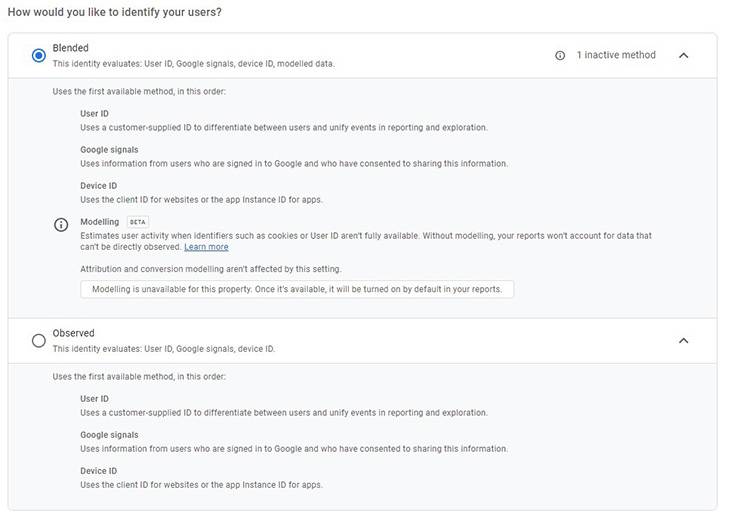

In fact, as you can see in the image above, Google Signals is now actually the primary non-managed ID. The user is identified by a managed User ID (which you can set if they log in), and if that’s not available Google Signals will be used. If no Signals data exists, GA4 will fall back to the Device ID (this is the cookie-stored client ID for websites).
This should mean that user identification is much more robust, allowing for a more seamless cross-device identification solution that is less impacted by ITP, while remaining privacy conscious.
Key take-away:
The new user definition is much more accurate and robust in today’s privacy-focused world.
Views are dead, long live Data Streams
Data Streams is a new concept for GA4 – there is no direct analogue in Universal Analytics to compare it to – and this can make them a little confusing at first.
To begin to understand Data Streams, we first need to recognize that GA4, unlike Universal Analytics, is a unified tracking solution. This means we are tracking multiple digital properties within a single analytics property.
In Universal Analytics, we would have a different property for our website and our mobile apps. If you are a service business, you may also have different properties for the marketing site and the service itself.
Within GA4, all of these digital properties are tracked in the same place, giving a holistic view of how users interact with our digital business. We will then have a Data Stream for each digital property which all feed into the same analytics property.
The first purpose of these Data Streams is identifying the data. There are no views in GA4 so instead you will need to filter your reports by the Data Stream if you want to analyse a specific digital property.
Key take-away:
Data Streams are a new concept representing the source of data you’re measuring in GA4’s holistic-measurement paradigm
Huge improvements to Custom Dimensions
While Google Analytics collects lots of useful data out of the box, and this is even more true of GA4, the real value of any analytics platform comes with adding data specific to your business, which is why the greater scalability and flexibility GA4 provides us here is so exciting.
In Universal Analytics, a free account had 20 custom dimension slots (non-numerical data) and 20 custom metric slots (numerical data). These could very quickly get filled by competing requirements on different parts of the website.
For example, you could collect a lot of custom data about your blog post, such as author and publication date, but then also need to collect a lot of custom data about your products or services, such as colour or availability.
In GA4, all custom data is stored in parameters which can be any combination of numerical and non-numerical data. The collection limit on parameters is an impressive 25 per event!
For data that non-analysts need to access all of the time inside GA4, you can choose some of these parameters to be custom dimensions and metrics – just like you had in Universal Analytics. The quota for these has been increased to 25 user-scoped dimensions, 50 event-scoped dimensions, and 50 custom metrics.
Because you’re defining all custom dimensions based on parameters, the setup is now much simpler and easier to use. You can just start passing any new data into a parameter straight away, without first setting it up inside GA.
And if that isn’t enough to get you excited, you can now collect floating point values & format custom metrics as distances using either imperial or metric measurements; in Universal Analytics we could only use integers, currency, or time.
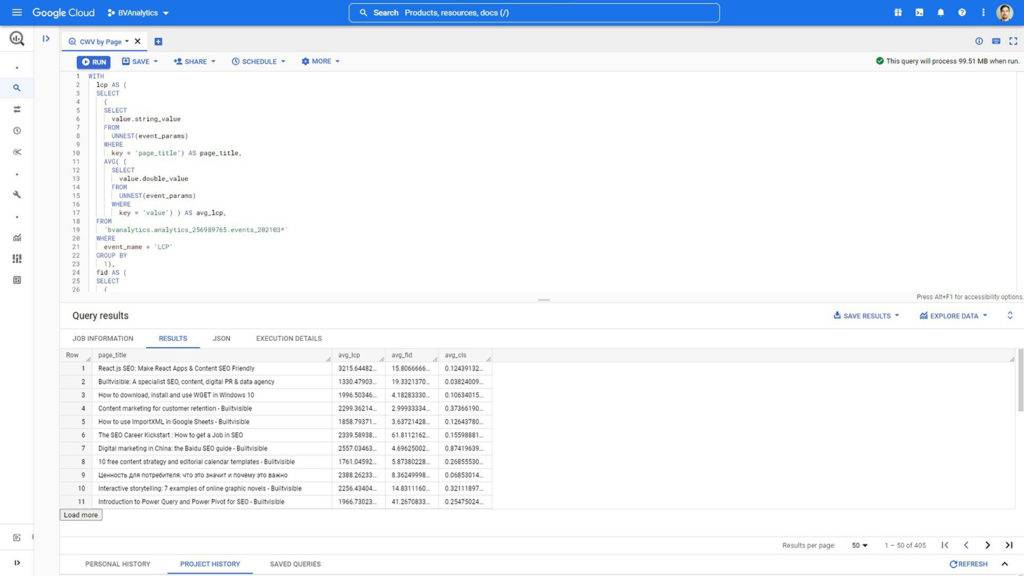
Let’s put all of that together. Below is a report created in BigQuery looking at how pages on builtvisible.com perform for Core Web Vitals. This report is something which I couldn’t create in Universal Analytics and can only be made using GA4’s new features.

Key takeaway:
GA4 provides greater scope for custom definitions with greater flexibility
Quick wins with Enhanced Measurement
A main focus of GA4 is making it as simple and efficient as possible to get started with collecting data.
Enhanced Measurement is a collection of actions which are common to most websites, such as site search and file downloads. GA4 allows you to start tracking these actions as events with a simple toggle switch within the admin settings, without the need to add extra event tags to your website.
Not only is this convenient, but it also allows you to measure several common interactions without eating into your 500 uniquely named custom events data quota!
Some of the Enhanced Measurement events are less useful than others – for example, scroll tracking events only offer a single measurement of 90% depth – but this is undoubtedly a very handy feature for small businesses with limited resources.
Key takeaway:
Enhanced Measurement isn’t a magic bullet, but it’s a big win for small teams looking to get started quickly.
Easily create or modify events without retagging
In Universal Analytics, it’s possible to modify some of the data collected using Advanced Filters. However, not all data can be manipulated in this way and setting these up can be confusing for many people.
In GA4, you can easily modify events after they’ve been collected with a simple rules-based UI. It can also be applied to any inbound event, which is a massive improvement.
As useful as modifying events may be, it’s the ability to create brand new events which most excites us.
You can streamline tagging by sending a single event for multiple, related actions, and then split these out into more specific events post-collection.
Not only does this allow for simplification of on-site tracking, but it also enables you to adjust your event structure to react to any changing insight requirements.
For example, builtvisible.com hosts a contact form at /contact-us but also at the foot of our product pages. Today, we collect a single event for all contact forms with a parameter to identify which type of form this was. However, in future, we may want to record these two types of form distinctly, or differentiate the specific location of the form – e.g. whether the form was on the SEO page or the Data page. GA4 allows us to do that without having to retag the site.
Key takeaway:
The ability to create and modify events within GA4 helps you adapt to changing measurement needs as your business scales.
Conversions – meet the new Goals
Conversions are essentially the new name for Goals within GA4 and serve the same purpose but with a few improvements.
The first is volume – we can define 30 events as conversions within GA4 vs just 20 Goals within Universal Analytics.
The second is flexibility – any event can be a conversion in GA4 and it’s a simple toggle switch to enable it. You can also archive conversions if they stop being relevant, or you want to replace it with something more specific.
This added flexibility means you no longer define conversions multiple times (once in your event tracking and again in your Goal definition). It also removes the headache associated with reassigning Goal slots.
For example, if you were previously tracking file downloads as a Goal in Q1 but reassign the Goal to tracking form submissions in Q2, you will have a single number that means different things when looking over the whole of H1. Now these are distinct and clearly understood.
Key takeaway:
Small improvements to creating and archiving conversions will make things clearer for everybody.
Explorations – Custom Reports get a long overdue upgrade
In Universal Analytics, our data is neatly bundled into pre-defined reports, but they are very inflexible.
In GA4, we have some simple overview reports, which enable us to explore our data and provide us with AI-driven insights. We can then build our own, flexible analyses in the new Explore reporting tool.
This is a big shift from the current situation of curated reports and custom reports as we have some summary stats and a big blank canvas on day one and once you get familiar with Explorations, you won’t want to go back.
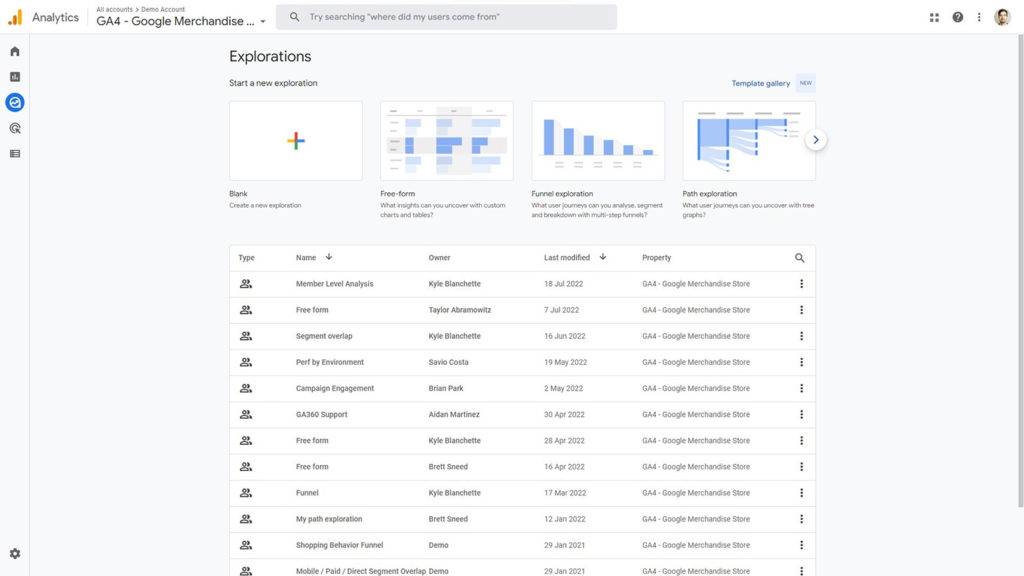

What Explorations give us over Universal Analytics Custom Reporting is a huge degree of flexibility and some additional functionality. The two that I’m particularly excited about are Funnel Analysis and Path Analysis – opening up what were previously 360 features.
Key takeaway:
New visualisation options unlock new ways to analyse data without building entire dashboards – it’s the upgrade we’ve needed for years.
Google BigQuery goes mainstream
One of the biggest reasons to get excited by GA4 is the availability of BigQuery exports for all properties.
BigQuery exports give you access to raw, unsampled data, allowing you to create reports and perform analysis without needing to download multiple, smaller reports to prevent sampling from impacting accuracy.
As a Google Cloud Platform (GCP) product, having your data available in BigQuery also simplifies advanced analysis and statistical modelling workflows by allowing you to easily access your data from within other GCP products, such as Google’s AI Platform.


Key takeaway:
BigQuery unlocks the true potential of GA4, giving you access to unsampled data and control of data retention, opening up a world of AI fun.
Predictive Audiences for proactive marketing
Speaking of artificial intelligence, Google is going big on embedding AI intowithin the heart of GA4 and Predictive Audiences is one of the first truly new features which shows us the direction they are headed in.
Rather than simply segmenting for converting or churning users, we can now segment for users who we believe are likely to take a specific action within a given time frame. For example, users who are likely to churn within the next seven days.
As with all other audiences, these can then be published to Google Ads to optimise paid media strategies. Perhaps you want to spend a little more to re-engage those who are likely to churn, to encourage them to continue buying from you.
Key takeaway:
AI is going to be big in GA4 – this first taste allows you to grow and protect revenues intelligently.
Marketing Attribution unlocked
In Universal Analytics, all standard reports used the last non-direct attribution model. While there were other models available within the Multi-Channel Funnel reports, we were very restricted on how these could be used.
Additionally, Data Driven Attribution (DDA), arguably the most useful of those models, was only available to 360 customers. Not only that, but the data was only relevant to the previous two weeks of data, because the model refreshed every fortnight. This was alright for fine tuning a campaign, but useless for budgeting and longer-term strategic analysis.
In GA4, we have access to a range of models, including DDA, and you are able to choose the model that is the best fit for you. That choice is made within the property settings and will be applied to all standard reports.
The attribution modelling is performed on the conversion, based on a lookback window you can also define, and not the session, as was the case in Universal Analytics. This means no more confusing sessions from ads that stopped running months ago, or organic sessions into non-indexed pages!
Key takeaway:
Finally you can decide what model works best for you and use this across the whole of Google Analytics. This will bring greater consistency and clarity for everyone.
Anomaly detection in your reports
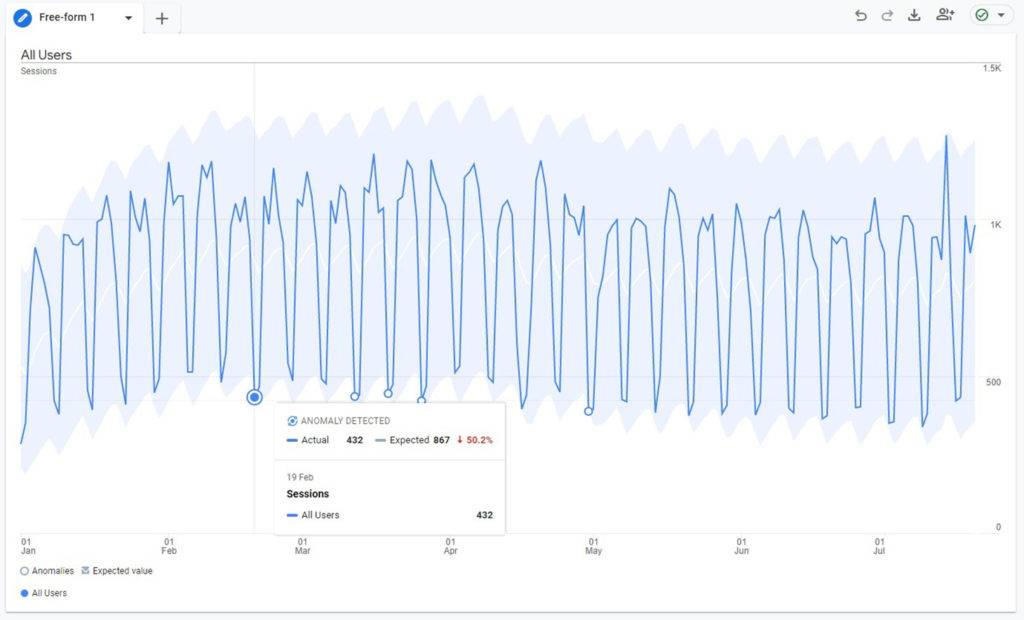
Google has been behind the curve on this one for a while so I’m really pleased to see anomaly detection in GA4 reports.
In Universal Analytics, we had some anomalies flagged within the insights panels on the home page, but these were limited and not visible within custom reports.
In GA4, unexpected data movements, such as a sudden drop in traffic or conversion, will be flagged within Explore reports. This makes anomalies much more visible and tailored to your analysis, allowing you to easily identify where to focus your efforts.

Key takeaway:
Anomaly detection saves everyone time by showing you what is out of the ordinary in your reports.
Final Thoughts: Make your migration a success
Because GA4 is so different to Universal Analytics, the change is much more analogous to platform migration than a simple upgrade. This can make it feel like a daunting task.
Key to any good migration is a solid process, which helps you to clearly identify what needs to be done and involves assigning owners to each step so that nothing gets lost.
At Builtvisible, we follow a five-step process for success, based on our experience with several successful migrations.
Generally speaking, we start with simple data collection, begin expanding this into a more complete and complex tracking set up, configure the settings and features to work for your business, and then start the big task of moving your day-to-day reporting tasks to the new platform.
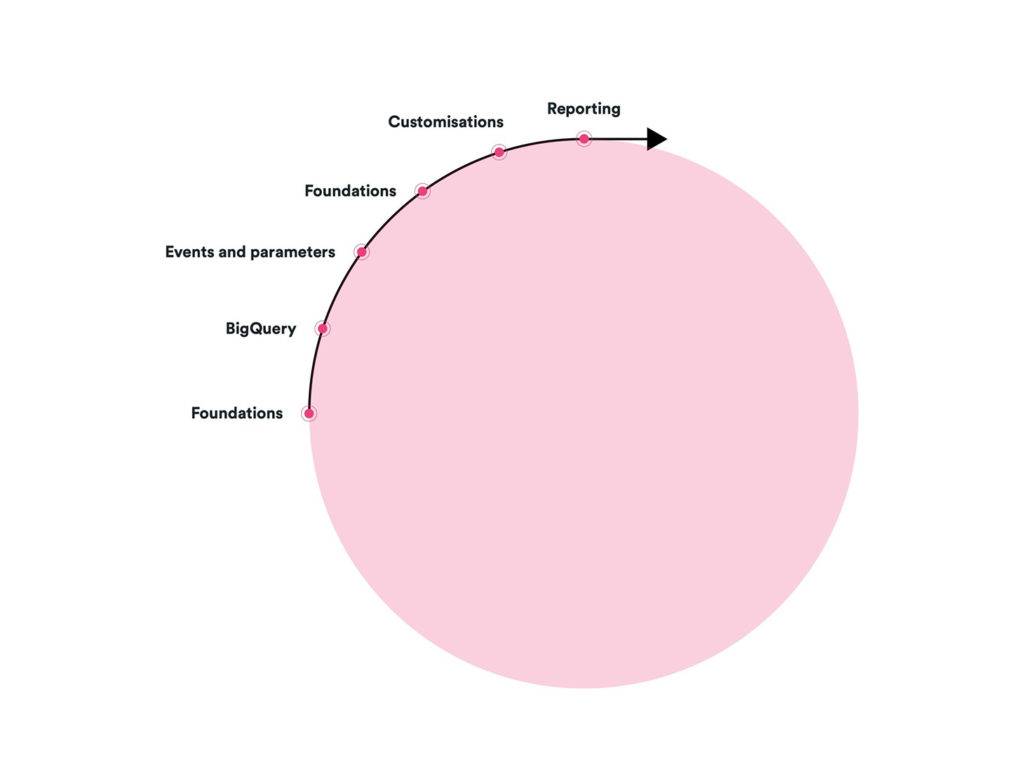

The inclusion of BigQuery at step two might raise a few eyebrows but the exports do not back-date, as they do for Universal Analytics 360, so setting this up early is a must in our book. It also allows your data scientists and analysts to start familiarising themselvesyourself with the schema in BigQuery while the migration progresses.
If you want to know more about this process and how it could help you make your migration a success, we’d love to hear from you.
Key takeaway:
This is a migration, not an upgrade. While it will always be complex, a little bit of planning and structure will ensure you’re successful.
As you can see, GA4 is very different, and it will come with a fair amount of new learning requirements.
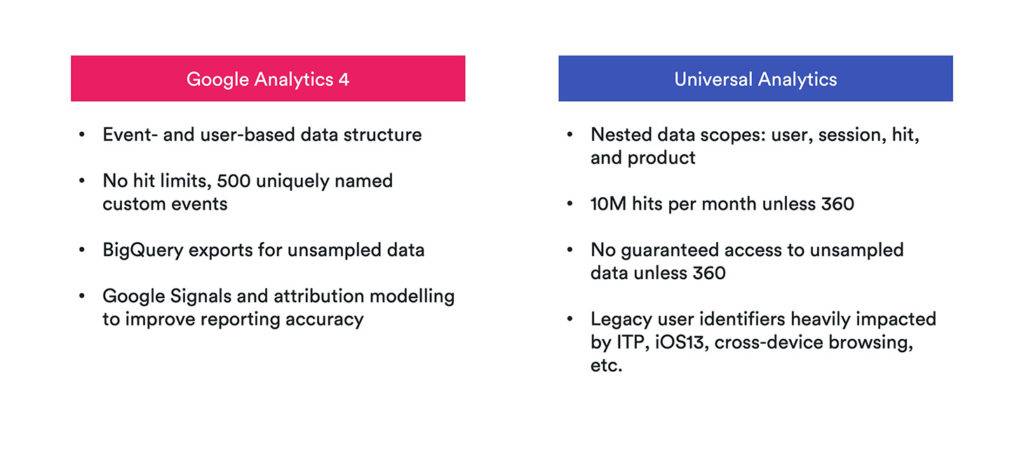

There’s also a lot to consider when starting your migration, to make sure you get it done successfully first time – with the clock ticking, this is really going to be essential.
While migrating to GA4 may seem daunting and confusing at first, we assure you it will all make sense in the end. Until then, if you need any support on your GA4 journey, we’re here to help.