The Basics of Tracking
What is Google Analytics?
It’s a service which collects data about your digital presence. Contrary to popular belief, the platform is not limited to just websites. It is now capable of tracking Android and iOS apps using the Google Analytics mobile SDKs, and indeed any connected device using the Measurement Protocol, a feature which opens up new realms of possibilities around the Internet of Things. For the purposes of this guide, however, we will stick to the platform’s original, JavaScript-based website tracking features.
How does it work? In short, for Google Analytics (GA) to function correctly, every page on your website must include a small snippet of code containing your unique GA ID (UA-XXXXXX-X). The code collects anonymous information about your site’s visitors and their behaviour, including their location and browser, their path through your website, and how they interact with specific pages. This information can then be accessed and analysed by you on the Google Analytics website.
Tracking Code
Unsurprisingly for a platform that’s been around for so long (2017 will be GA’s 12th birthday!), there are a few different types of tracking code you may encounter out in the wild. Each of these can vary significantly in terms of syntax, but the format of the account information is a good general indicator of version. This is presented below, from oldest to newest:
// Urchin:
_uacct='UA- XXXXXXX-X';
// Traditional:
var pageTracker = _gat._getTracker('UA-XXXXXXX-X');
// Asynchronous:
_gaq.push(['_setAccount', 'UA-XXXXXXX-X']);
//  Universal:
ga('create', 'UA-XXXXXXX-X', 'auto');
Either of the last two may be fired by Google Tag Manager (GTM), rather than by standard on-page tracking code. In these cases, the GA account information won’t be visible in the unprocessed source code. Instead, you’ll need to rely on the Google Tag Assistant extension for Chrome to determine which version of the tracking code is being fired. You should also be able to see the GTM container snippet in the source, which should look something like the following:
<!-- Google Tag Manager -->
<script>
(function(w,d,s,l,i){w[l]=w[l]||[];w[l].push({'gtm.start':
new Date().getTime(),event:'gtm.js'});var f=d.getElementsByTagName(s)[0],
j=d.createElement(s),dl=l!='dataLayer'?'&l='+l:'';j.async=true;j.src=
'https://www.googletagmanager.com/gtm.js?id='+i+dl;f.parentNode.insertBefore(j,f);
})(window,document,'script','dataLayer','GTM-XXXXXX');</script>
<!-- End Google Tag Manager -->
Do I need to upgrade?
You’ve already been upgraded. Surprise!
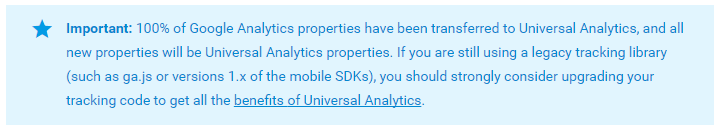
The most recent version of GA, known as the ‘Universal’ syntax, was announced in 2012, left beta in 2014, and all accounts have since been forcibly upgraded at the property level. It’s still common to come across legacy tracking code – while this will generally continue to function, there are dozens of reasons why your data may be inaccurate. If you make decisions based on your Analytics data, make updating your tracking code a priority. You can consult Google’s official Upgrade Guide here, or get in touch with us if you require assistance.
We’ll discuss some common tracking code problems in the last section of this guide, but for now, let’s move on to the place you’ll spend most of your time: your GA account’s main interface.
Account Structure
All implementations of GA are split into an Account / Property / View hierarchy. This is easiest to understand when visualized:
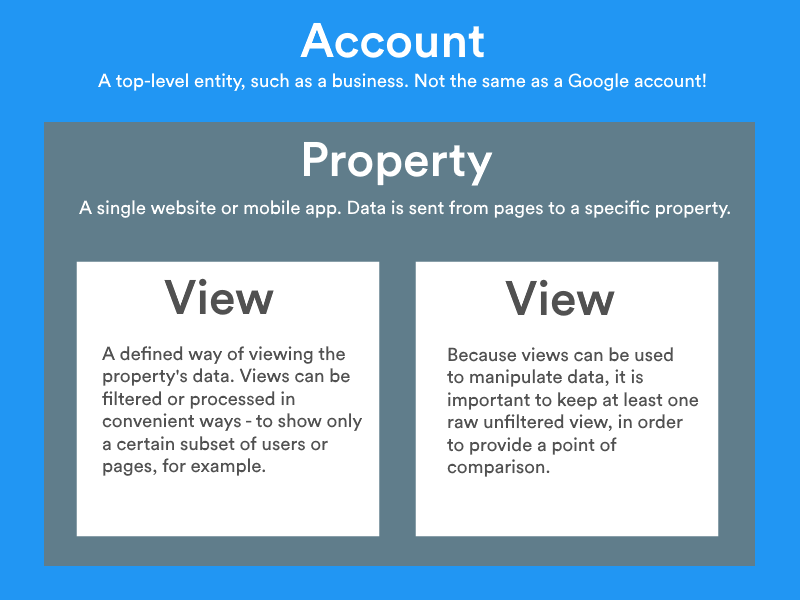
- An Account – not to be confused with a regular Google account – is the highest-level entity you can create. This would typically be your business. Each account can in theory hold up to 50 properties, although such a number is rarely necessary. Complex scenarios aside, I generally recommend sticking to a one-property-per-account arrangement unless you have a very good reason to do otherwise. This helps keep your setup lean and efficient.
- A Property is a specific website or mobile app. Tracking code fires data to the property-level, identified by its Unique ID number. Take the ID in Builtvisible’s tracking code as an example: UA-430882-9. The middle portion (430882) is the account number; the digit at the end (9) is the property number. Note, however, that it recently became possible to transfer properties between accounts, so don’t make assumptions based on this number.
- Views are your access points for reports. A view is a defined way of viewing the data from a property, perhaps filtered or processed in a certain way. Each property can hold 25 views. Because the data in a view can be manipulated, it’s very important to maintain at least one raw unfiltered view to provide a point of comparison; a control variable, if you will.
Permissions & User Rights
Permissions and access rights can be granted at any of the above levels: account, property, or view. They are set and managed using regular Google Accounts – the same credentials you use to access Gmail, Search Console, and other Google products. Four permissions are available:
- Manage Users: Add or delete users and assign permissions.
- Edit Add, modify, or delete accounts, properties, and views.
- Collaborate: Create and share personal assets, dashboards, annotations.
- Read & Analyse: Can access, pivot, and manipulate data.
Top tip: Audit the permissions for all GA accounts you are tasked with managing. Anyone requiring access to a particular account should generally be granted Collaborate permissions in addition to Read & Analyse, since this enables them to make meaningful contributions without any risk of data loss. The more powerful permissions – Manage Users and Edit – should both be restricted and closely monitored, for the sake of data integrity.
Data Integrity & Filters
We’ve already mentioned the importance of having at least one raw unfiltered view. If we’re to make decisions based on GA’s reports, we must be confident in the integrity of our data, and that means having a clear understanding of the roles of each of your views.
Head to the Admin panel by clicking the cog icon in the lower left hand side of your screen. Select the appropriate property and view using the drop-downs, then hit the Filters button. You’ll require Edit permissions to see it.
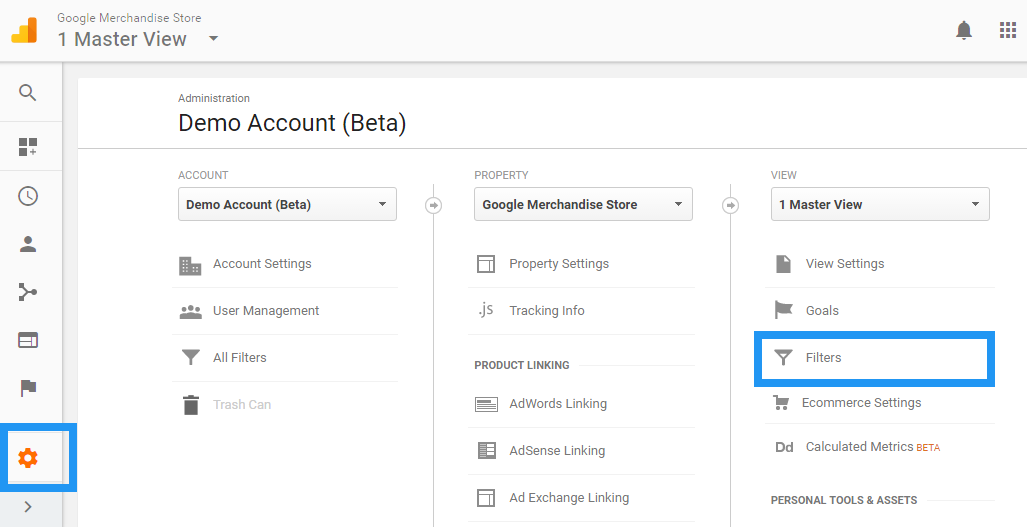
Filters enable us to pre-process or manipulate a view’s data before it even arrives in the reporting interface. They’re extraordinarily powerful; we can use them to execute find & replace operations on the property’s URLs using regex, as well as writing simple rules to include or exclude certain groups of pages or users. They’re destructive by nature, cannot be applied retroactively, and permanently change the view’s data for as long as they are active, so handle filters with care!
One of the most common use cases for filters is to exclude traffic from your internal network – by creating an Exclude rule for your office’s IP address, you can prevent your staff’s interaction with your website from being tracked. For more detailed guidance on filters, be sure to read the official documentation and the LunaMetrics introduction.
Data Processing & Test Views
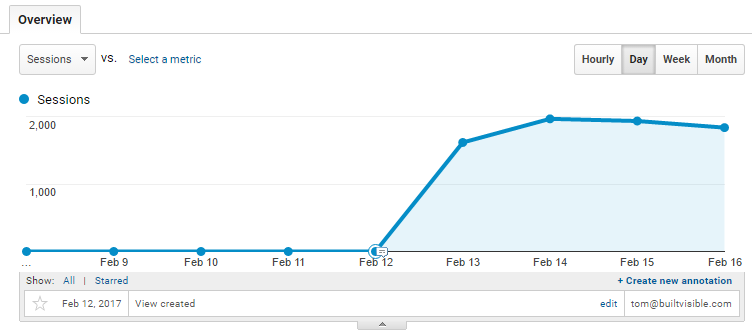
One final tip on account structure before we move on to the nitty-gritty of reporting: a view will show data from the date it was created onwards. This sounds obvious, but given that (a) views cannot be populated retroactively, and (b) filters are permanently destructive, it has some interesting implications.
Imagine you decide to create a view for the purposes of an experiment. Even if you copy an existing view, the new view will be empty; data will only start to populate after the view has been created. This means that all newly-created views lack historic data for date-based comparisons.
This is just one of the reasons why it’s a very good idea to have at least one ‘Test’ view running at all times. By occupying a handful of your 25 view slots with copies of your master reporting view, you will guarantee yourself readily-configured and conveniently-populated views whenever you need them. These can be used to test new filters before you apply them to your main reporting view, insulating your master dataset against potential errors.
Reporting Interface
Select a view, and you’ll be presented with the main reporting interface. Google has recently made some fairly drastic changes here, so we’ll start by breaking down exactly what each area of the interface does.
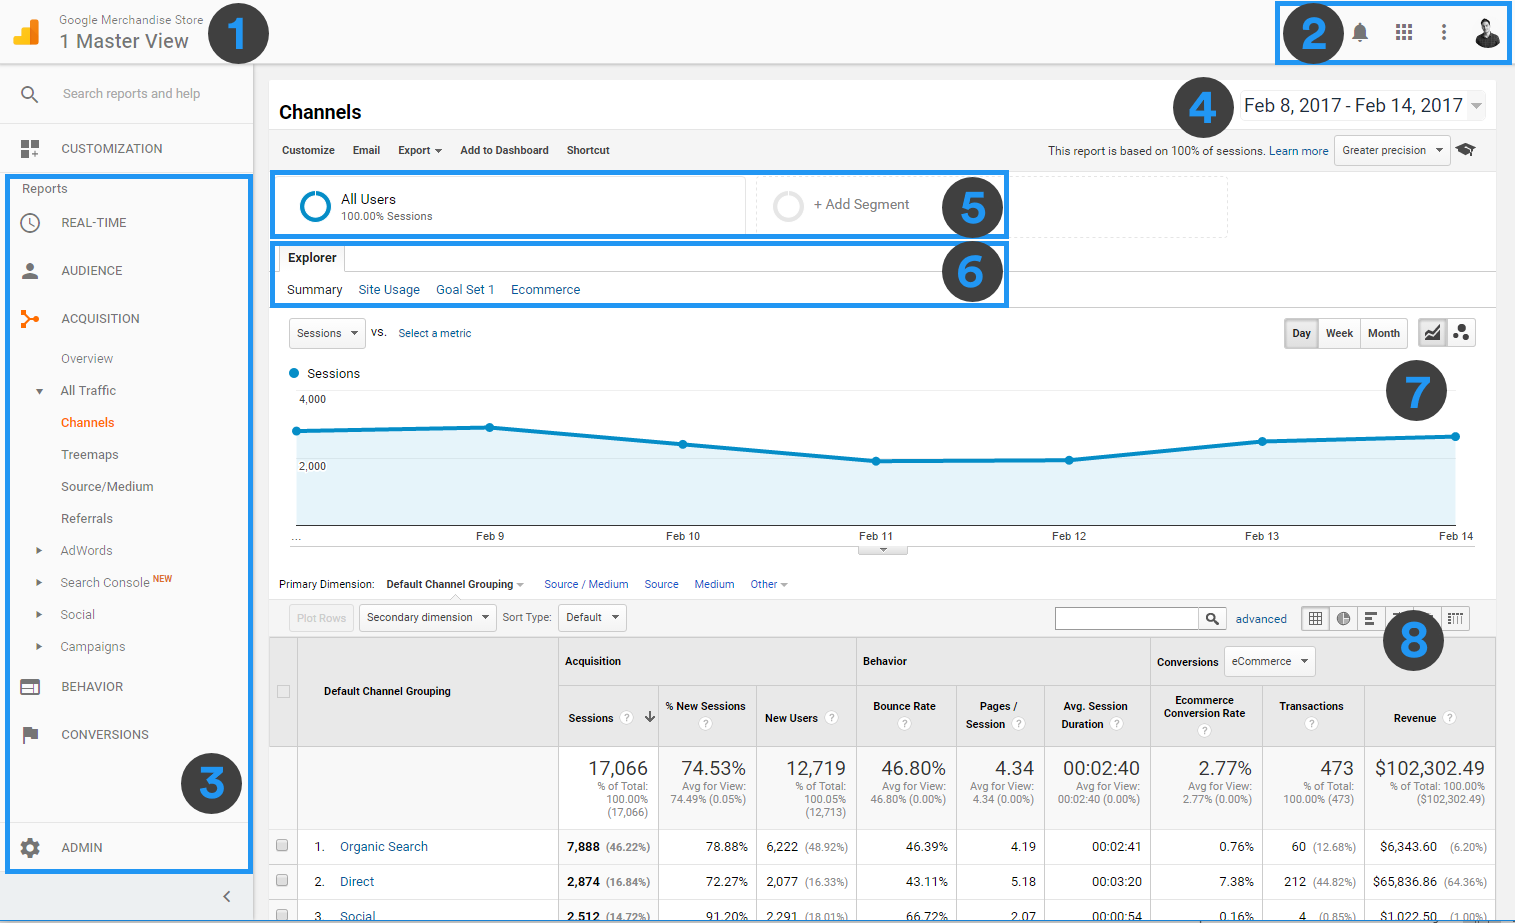
- Hierarchy Navigation
Allows you to easily switch between accounts, properties and views. - Accounts, Settings, and Notifications
Your personal Google account, links to other Analytics Apps like GTM, and notifications about the current property. - Report Navigation
Your primary means of navigating to a particular set of data in GA. The five main reporting groups are Real-Time (live data), Audience (including geography, technology, demographics), Acquisition (traffic sources, social, AdWords), Behaviour (landing pages, content performance, events), and Conversions (goals, ecommerce, attribution). - Date Picker
This appears at the top of every Analytics report, and allows you to change the date range reflected in the report. You can also use the Date Picker to compare two date ranges. - Segment Configuration
Segments are subsets of your Analytics data. We won’t be covering them in this guide, but they can be a powerful way of contrasting different groups of data. - Report Tabs
Allow you to switch between multiple versions of the same data. Most reports – like the one above – include an Explorer tab, which presents your data in both visual (charted) and tabularised forms. Below these tabs are the Metric Group buttons (Summary, Goal Set 1, Ecommerce, etc) – these simply determine which metrics are displayed in the data table. - Graph Display
While these areas of the interface will vary depending on which report you’re viewing, most Explorer tabs will include a graphical view of your data. - Data Table
Your data in tabularised form, plus controls for searching and pivoting. You can change the sort order, apply visualisations, change or add dimensions, and execute advanced searches.
Learning Your Way Around
While the annotated diagram above should get you started, the best way to learn your way around GA is to experiment. If your permissions over your company’s GA account are limited, or you have reason to doubt the integrity of its data, a great way to get exposure to a fully-functional implementation is to use the official Demo Account.
This was launched less than a year ago, and very few people are even aware that it exists. It’s populated with real business data, and includes all the major features you would expect: AdWords linking, events & goals, and even Enhanced Ecommerce.
You can read more about the demo account over on the official Analytics blog, and instantly grant yourself access by clicking here.
Key Concepts
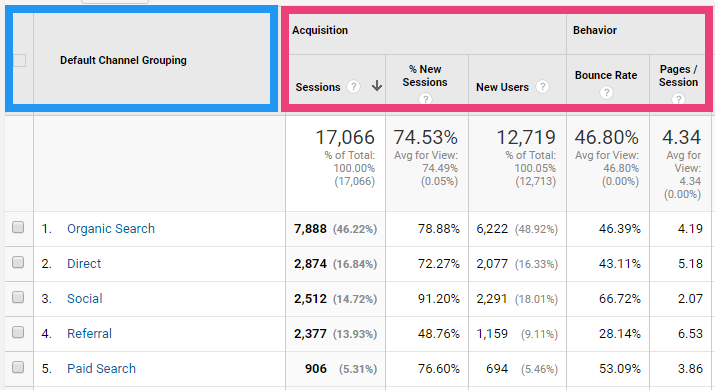
Dimensions vs Metrics
Dimensions describe data. Think of them as the ‘what’: what keyword did the visitor use, what browser are they using, what city are they from.
Metrics measure data. Think of them as answering ‘how many’ or ‘how long’: how many pages did they view, how long did they stay on the site.
In the data table below, the primary dimension is marked in blue, and the associated metrics are in pink.
See Also: Google’s Dimensions & Metrics Reference Guide
Sessions vs Pageviews
A session is a series of interactions by a user on your website. One session can include multiple pageviews, events, and ecommerce transactions.
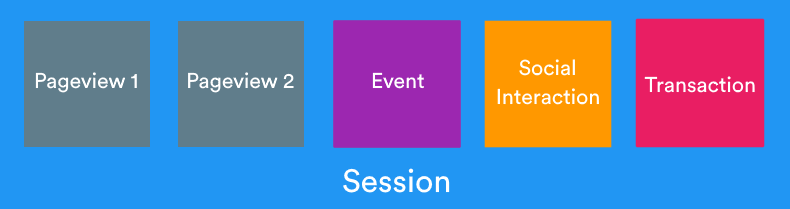
There are two main ways a session can end:
- Time-based expiration: At midnight, or after 30 minutes of inactivity.
- Campaign change: User arrives via one campaign, leaves, and then comes back via a different campaign.
See Also: How a session is defined in Analytics
Bounce Rate vs Exit Rate
A bounce is a session in which a user leaves your site from the entrance page without interaction. A page’s bounce rate, therefore, is a metric which measures the percentage of users who landed on that page and left the site without interaction.
An exit is simply the end of a given session. A page’s exit rate, therefore, is the percentage of its pageviews which were the last in their session. Think of it as: number of exits / number of pageviews.
See Also: Exit Rate: At a glance
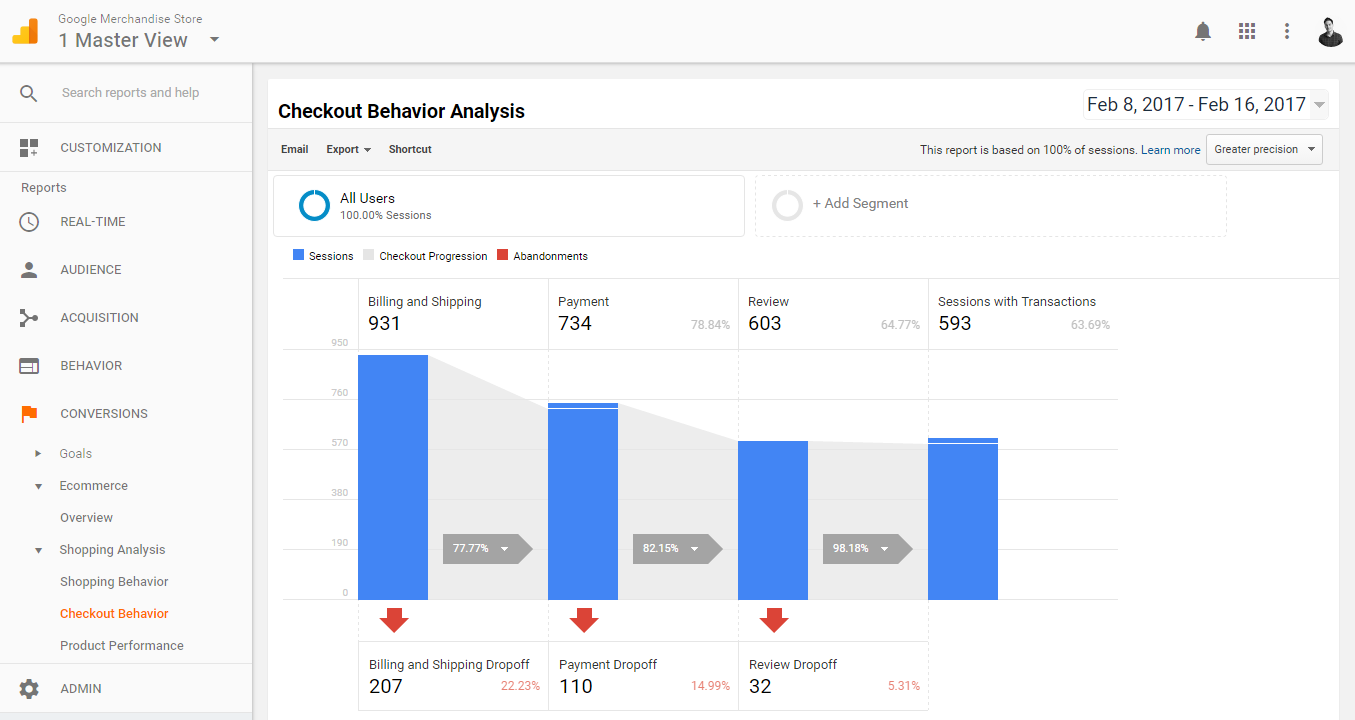
Events vs Goals
The difference between events and goals is easiest to understand by explaining what each one should be used for:
- Goals should be used to measure the success of your KPIs, whatever they are. A goal can be based on the occurence of an event.
- Events should be used to track any relevant user interactions.
Goals are limited to 20 per view and cannot be deleted; while you can deactivate a goal and reuse its slot, historic data will still be present. They also enable complex reporting on conversions which isn’t possible with events, such as the ‘Goal Flow’ report. All goals fall into one of 5 types, which are listed below.
- Description: A specific page is viewed.
- Duration: A session lasted at least a certain amount of time.
- Pages/Screens per session: A certain number of pages were viewed.
- Event: A particular event is triggered.
- Smart Goals: An automated conversion tracking method for AdWords advertisers.
Unlike goals, events can be anything, and the number of events you can create is limited only by the standard GA data collection quotas, at the rate of one hit per second. All events fall into the following hierarchy:
Category > Action > Label (optional) > Value (optional)
A user downloading one of your resources, for example, could trigger an event which falls into the category Download, the action PDF, and the label resource_name_1.pdf.
It is important to decide on a clear naming convention for events, or else your data can easily become useless. All event attributes are case-sensitive and must be clearly descriptive, so use Excel to design a clear hierarchy before you begin (or design a new hierarchy if your data is a mess!).
See Also: About Events
See Also: Event Tracking Implementation: Developer Guide
Content Groupings vs Custom Dimensions
Content Groupings enable you to organise your existing pages into logical groups which reflect your business goals or reporting requirements. Custom Dimensions let you record additional, non-standard data about users, sessions, or pages, and can be used in conjunction with the Data Import feature.
Non-premium GA gives you 5 Content Groupings per View and 20 Custom Dimensions per Property. Because Custom Dimensions are applied at the property-level, they are available to use as filters which can be applied to Views. Content Groupings, on the other hand, are often easier to implement and can also be used with the Behavior Flow report.
See Also: Getting Started with Content Groupings
Tools & Resources
- Google Analytics Help Center – Official GA support hub
- Google Tag Manager Help Center – Official GTM support hub
- Google Developers: analytics.js – Documentation for developers
- Google Tag Assistant – A Chrome extension which is now the single most useful tool for debugging GA & GTM.
Thanks for reading! For more resources on Google Analytics and Google Tag Manager, be sure to check out the Measurement category on our blog. If you require help with your web analytics software, you can read more about our Analytics auditing services.