Why is page experience important?
Google has always been focused on providing users with the best experience possible. In the past, they achieved this with traditional ranking factors that were focused on the informational value of pages and trust signals, such as backlink profiles. Page experience was subsequently introduced as a ranking factor to enable Google to more effectively surface fast-loading mobile-friendly sites that provide a better user experience.
An important thing to note is that content quality and relevance to searcher queries has remained crucial for rankings, as can be seen by recent quality updates such as the E-E-A-T update and Helpful Content Update that were both released last year in 2022. A page with low-quality content that loads fast won’t necessarily rank higher than a page with high-quality, relevant content.
However, strong page experience signals can help to boost a page’s rankings if it has a similar content quality and backlink profile as its competitor pages. For example, an ecommerce category page that has a similar content and product offering as an equivalent competitor page – as well as having a similar number and quality of backlinks – could edge out its competitors and be ranked higher if it has stronger page experience signals.
For example, if the competing category pages below had similar backlink profiles and an equivalent quantity and quality of on-page content, from optimising page experience signals, one of these pages could start outranking the other.


Page experience is made up of five different signals which focus on the quality of a user’s experience of a page. These signals are:
- Core Web Vitals
- Mobile-friendliness
- Safe browsing
- HTTPS
- No intrusive interstitials

What are Core Web Vitals?
Core Web Vitals are a set of speed metrics that measure a user’s perception of page load speed, responsiveness and visual stability. This initiative was initially launched by Google in May 2020 to provide guidance for measuring and improving the user experiences that our websites provide.
Core Web Vitals were important metrics to introduce because they helped us to shift our focus from actual page load to perceived page load. Traditional site speed metrics alone don’t always tell the whole story of page load, and this is why Google needed to introduce a wider variety of more nuanced metrics that help to tell the real story of how users actually perceive the loading of a page.
For example, if you were looking at page load time as a measure of page performance, a tool might tell you that the pages below loaded in 6.5 seconds and 6.4 seconds, respectively.
However, a user would think that the page on the left had loaded much faster because the above-the-fold content populated quickly, and everything else loaded in the background without obstructing their experience of the site.
To the user, the page on the right actually loaded in 1.2 seconds, not 6.4 seconds.

Core Web Vitals are tangible, quantifiable metrics that allow us – and Google – to measure user experience by covering three areas of page load experience:
- Loading: this is measured by Largest Contentful Paint (LCP)
- Interactivity: this is measured by First Input Delay (FID)
- Visual stability: this is measured by Cumulative Layout Shift (CLS)
Introducing INP as the new responsiveness metric
Google has announced that, from March 2024, First Input Delay (FID) will be replaced by a new metric, “Interaction to next paint” (INP), which Google has described as “a better responsiveness metric”.
The limitations of FID
First Input Delay measures the time between when a user first interacts with a page, to when the browser is actually able to respond to that first interaction.
This has been an important metric to measure because a page that visually loads quickly but isn’t usable for a significant amount of time provides a negative user experience. It can almost be more frustrating for a user to see a page that they can’t do anything with if it doesn’t respond to their actions.
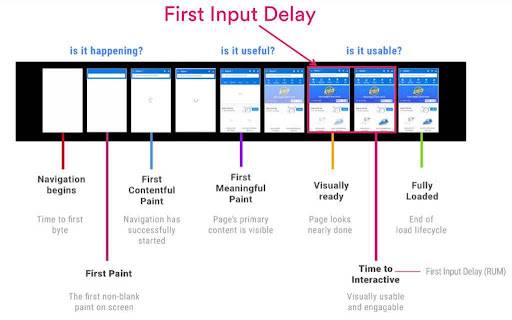
However, note the emphasis on the fact that it only measures the responsiveness of the first interaction, which is one of the key drawbacks of using this as a metric to measure a page’s overall responsiveness.
Other limitations of this metric that Google has been aware of for some time are the fact it only captures the delay between a user’s interaction and the page’s initial response, instead of the time it takes for the full interaction to take place. In addition, FID doesn’t account for groups of events that might occur together as part of the same interaction.
When we take these factors into account, we can easily see the drawbacks of using FID as a way to measure the overall responsiveness of a webpage.
The benefits of INP
In March next year, Interaction to Next Paint (INP) will replace FID as the Core Web Vital responsible for measuring page responsiveness. This metric will measure how much time elapses between a user interaction and the next time the user sees a visual update on the page.
The first improvement here is that this metric takes all user interactions into account, not just the first one. INP is a single value that’s calculated when the user leaves the page, and it’s the interaction with the slowest response time (ignoring outliers) that’s measured.
A user interaction counts as any of the following:
- A mouse click
- Tapping on a touchscreen device
- Pressing a key on a keyboard (either physical or onscreen)
The second important improvement is that INP accounts for the fact that multiple events can make up a single interaction. For example, a single tap on a touchscreen device would count as a single interaction; however, this in itself is made up of several events such as ‘pointerup’, ‘pointerdown’ and ‘click’. It’s the longest event within the interaction that’s used to measure the latency between the interaction and the next visual paint.
Note that scrolling and hovering don’t count as user interactions in the calculation of INP, therefore it’s possible for a page to not have an INP score.
How to check your current INP performance
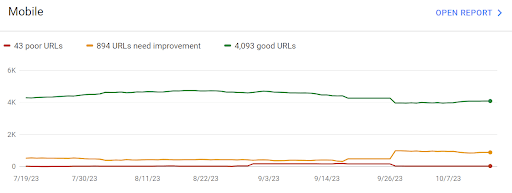
The Core Web Vitals continue to be reported on within Google Search Console (within ‘page experience’ on the left-hand side) using the standard classification of
- Good
- Need improvement
- Poor
This data is provided in graph or table format across both desktop and mobile, as it has been for some time now:
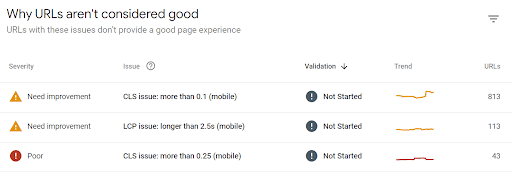
Clicking into a row in the table then provides you with more detail on the issue, including page templates affected by the issue, and how many URLs sit within each template.
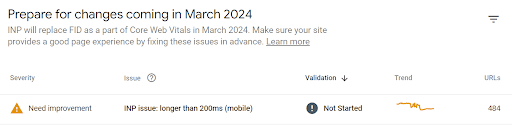
However, a recent addition is that now when you navigate to Google Search Console’s Core Web Vitals report you will see the following message at the top of the page:
When navigating to either the mobile or desktop Core Web Vitals standard reports, by scrolling to the bottom you’ll now see a dedicated INP report. If your site currently has issues, it will display these:
However, if your site is ready for the introduction of INP and has no issues, this table will instead contain the following message:

Remember that mobile and desktop scores differ significantly, so we always recommend running separate audits for desktop and mobile. In fact, the example screenshots above are from the same domain, but on mobile there are issues with INP, while on desktop no issues have been detected.
How to audit INP
INP is quite complex to audit, however a good starting point is using the Web Vitals Chrome Extension. Once installed, you need to update the settings in the extension to enable ‘Console logging’ and then save:

Now, you can navigate to a URL that you want to test. By accessing the console (right-click ‘Inspect Element’ then select ‘Console’) you’ll see each of your interactions with the page logged as an ‘interaction’ within the console.
For example, by navigating to the below product URL on bravissimo.com and clicking to expand the ‘product detail’ tab with the Console open, we can see the time for this specific interaction was 136ms. The INP score is then also logged as 136ms, because at this point this is the only interaction we’ve had with the page:

Above: clicking on the ‘product details’ accordion to expand the tab was an interaction that took 136ms. As the first interaction on the page, this produced a corresponding INP score of 136ms.
You’ll notice that as you continue to interact with the page, the INP score will continually update. This is because, as stated above, the INP score is based on the interaction with the slowest response time (ignoring outliers) that occurs before a user exits a page. Therefore when an interaction is logged that’s the longest so far encountered, the INP score will update accordingly. See the example below from another page that we interacted with:

Above: in this separate example, the INP score is originally 80ms but updates to 136ms when an interaction of that length is later recorded. Note the subsequent interactions do not cause the INP score to update; they would need to exceed 136ms in order to do so.
You can click into each interaction in the Console to see the events that made up an interaction. These events are each split into three phases:
- the input delay (how long it takes for the browser to start processing the user’s interaction with the page)
- the processing time (how long it takes for the function the browser runs to be completed in response to the user event)
- the presentation delay (how long it takes for the browser to display the visual result of the interaction)
In the example below, the interaction is made up of three events: pointerdown, pointerup and click. We can see that the presentation delay on the pointerup event had the longest latency (84ms):
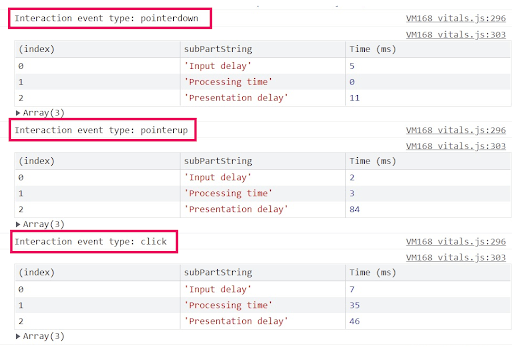
While the interaction above had a good score, why can see that in having access to this breakdown of events it’s possible to see exactly what area(s) need the most improvement. You read more about using the Core Web Vitals plugin to analyse INP, as well as the other Core Web Vitals metrics, here.
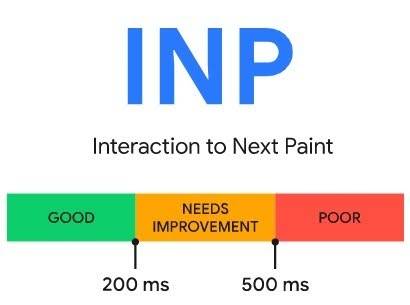
Google recommends an INP score below or at 200 milliseconds:
When looking at optimising INP, you need to consider improving the three phases of an interaction that we mentioned above (input delay, processing time and presentation delay). Google has full documentation on optimising INP here, but below are some good starting points:
- Avoid heavy JavaScript execution: methods like code splitting, deferring or asynchronously loading and code minification can help to reduce the time taken for the browser to process and execute JavaScript code, which frees up the browser to respond to user input faster.
- Reduce main thread blockages: watch out for long tasks, as these are instances where the main thread is being blocked for a significant amount of time. By breaking up long tasks (anything that takes longer than 50ms to run) into several shorter tasks, this enables the browser to respond to user interactions more quickly. You can identify these in the performance tab of Chrome DevTools.
- Resource-intensive third-party code: remove or defer loading of third-party scripts which can otherwise delay rendering of the main page content. These can often include tracking scripts and resource embeds. This is something you can easily find in PageSpeed Insights.
- Avoid layout thrashing: this is when the browser has to repaint the page several times before it’s able to finish loading, due to JavaScript causing the browser to re-run style and layout calculations several times. This slows down how quickly the browser is able to respond to user input.
- Minimise the DOM size: this can be achieved by removing unnecessary HTML markup, as well as flattening the DOM structure by nesting fewer components. Running Lighthouse will show you if your DOM size is too big.
- Use the content-visibility CSS property: this considerably improves page load speed by deferring rendering of elements that are not within the user’s viewport. This reduces blockages in the main thread (see above) which, as already mentioned, allows the browser to respond to users more quickly.
A re-cap of the other two Core Web Vitals
Largest Contentful Paint
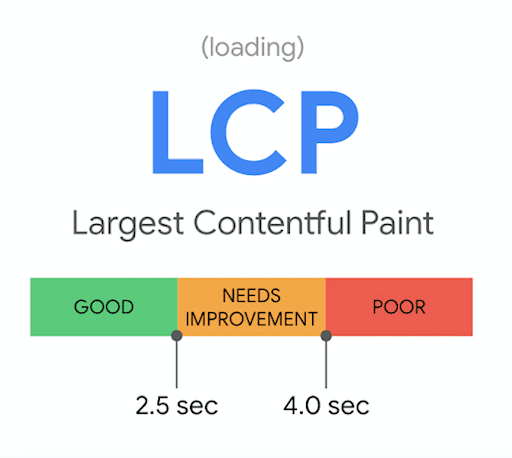
LCP measures the time when the largest element of the page is rendered on the screen. This could be an image, a video or a block of text, depending on how much of the viewport it takes up. This metric has been introduced by Google to measure when a page appears to be visually loaded for users.
You can identify the LCP element of a page by inspecting it in Chrome DevTools. In the ‘Performance’ tab, you’ll find the timings of different metrics. If you hover over the LCP timing, the corresponding element of the page will be highlighted.

In this waterfall view, you can also identify tasks and dependencies that are preventing LCP from happening sooner.
Google recommends making sure that LCP should occur within the first 2.5s of a page loading.
The main issues that impact LCP timings to watch out for are:
- Slow server response times: this can be improved by preloading key requests to help the browser prioritise what to load first, such as the LCP element on a page and important above-the-fold content, which the user needs to see to perceive that a page is visually ready.
- Render-blocking JavaScript and CSS: JavaScript and CSS files are render-blocking by default, meaning that content can’t be rendered until all of those requests have been completed. Removing, deferring or asynchronously loading non-essential, render-blocking scripts can reduce the time taken before the browser can load the page’s LCP element.
- Slow resource load times: tactics like compression to reduce file sizes and preloading can help to increase the load speed of key elements like images.
- Client-side rendering: this JavaScript rendering method puts the work onto the browser or search engine bot trying to access the page’s content. If a user is browsing with a device with a lower quality CPU, this can significantly impact load speed. If you rely on client-side rendering for the crucial content, then look into additional solutions like server-side rendering or dynamic rendering.
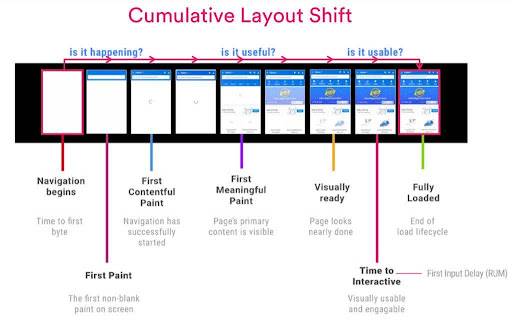
Cumulative Layout Shift
CLS is a score that measures the overall layout shifts that occur on a page between when it starts and finishes loading. CLS isn’t a timed metric like LCP or FID, it’s a score that’s given to a website based on how much the visible content shifts within the user’s viewport during the loading process.
The visual comparison feature in WebPagetest is great for visualising layout shifts on a page during loading and can highlight differences between your page templates and those of your competitors.

The optimal CLS score of a page is less than 0.1.

The most common causes of poor CLS scores are:
• Images without dimensions: specifying image dimensions helps the browser to more accurately plan the layout of the page without it shifting too much as images load.
• Ads, embeds, and iframes without reserved space: when a page element doesn’t have a reserved space to load into, it shifts the rest of the page content that has already appeared on the page so they can fit in.
• Dynamically injected content: avoid inserting new content above existing content as the page loads, unless the appearance of this content is in response to user input.
• Web Fonts causing FOIT (flash of invisible text) or FOUT (flash of unstyled text): using ‘font-display’ and the Font Loading API helps to resolve issues where fonts disappear or are swapped out as they load, causing layout changes.
Now let’s explore the other metrics, aside from the Core Web Vitals, that Google considers key to a strong user experience.
The other metrics that make up good page experience
Mobile-friendliness
Mobile-friendliness is one of the user experience criteria incorporated into Google’s ranking algorithms. The mobile-friendliness of a page is determined by how easy the page is to use and navigate on mobile devices.
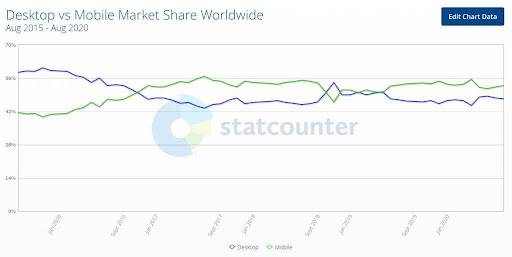
Since mobile traffic overtook desktop traffic back in 2016, it has been even more important to focus on optimising website experiences for mobile devices, as this is where the majority of traffic comes from – depending on the vertical of a website.
Also, since the introduction of mobile-first indexing by Google a few years ago, websites are being crawled with smartphone user agents by default, so this is yet another reason why focusing on mobile usability is important.
Auditing mobile-friendliness
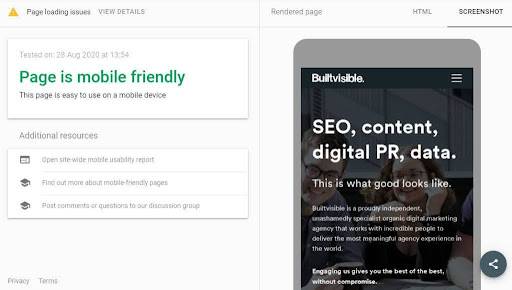
To assess mobile-friendliness on a page-by-page basis, you can run URLs through Google’s Mobile-Friendly Test.
Google Search Console’s Mobile Usability report provides a useful top-level view of how mobile-friendliness is trending across all pages on your site. Here is an example of the mobile usability issues we found for one of our clients when we performed a page experience audit on their website:
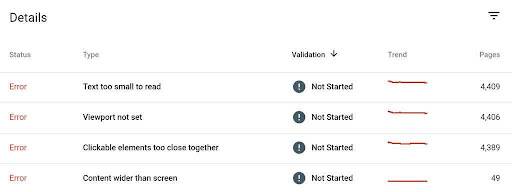
These are the key errors that are flagged in Google Search Console’s Mobile Usability report – which would be beneficial to monitor for page experience:
- Uses incompatible plugins: plugins are used that are not supported by most mobile browsers.
- Viewport not set: the page does not have a viewport property set, which tells the browser how to adjust the page’s dimension depending on screen size.
- Viewport not set to device-width: a fixed-width viewport is set, which means it can’t be adjusted for different screen sizes.
- Content wider than screen: users need to scroll horizontally to see all of the page’s content, as it doesn’t scale to their device.
- Text too small to read: the font size is so small that users would be required to zoom in to read it legibly.
- Clickable elements too close together: buttons and links are so close to each other that they can’t be easily tapped individually without selecting a neighbouring element.
Safe browsing
Safe browsing relates to whether there is any malicious or deceptive content detected on the website in question. This includes security issues like malware and phishing content.
Auditing safe browsing
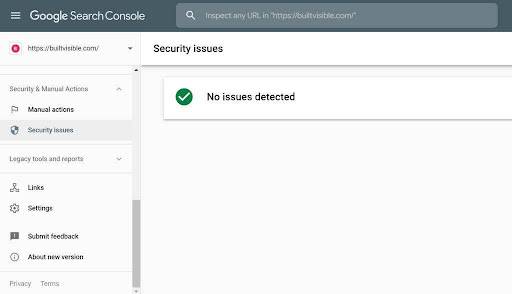
To assess whether or not a site is safe, check the ‘Security issues’ report in Google Search Console. This report will highlight instances of hacked content, malware and unwanted software, and social engineering content that tricks visitors into revealing confidential information or downloading software. It will also provide a sample of affected pages to help you identify where these issues are coming from.
All sites should be served via HTTPS rather than HTTP to ensure secure connections for users. This is something that Google advises as well, as HTTPS has been used as a light ranking signal for years now.
Auditing HTTPS
You can spot check the connection security by looking at the icon next to the URL in the Chrome browser. If any URLs have the ‘Info’, ‘Not secure’ or ‘Dangerous’ icons, then this will need to be investigated and fixed.

To gain a more holistic view of non-HTTPS pages, you can also run a full website crawl which includes the resources on your site such as scripts, images, and forms that require the input of user data. All internal links to HTML pages and scripts should be filtered down to the HTTP protocol to identify any URLs that need to be migrated to HTTPS.
Screaming Frog has a dedicated ‘Insecure Content’ report that can be exported and can help you when auditing website security and HTTPS.
The following advice from a Google Search Console help guide can form a good foundation for HTTPS auditing:

Intrusive interstitials
Interstitials that cover crucial content and impede the user’s journey on a site should be avoided. As part of a mobile usability update in 2017, Google introduced an interstitial penalty, which would demote pages in organic rankings that didn’t have their content immediately accessible to users.
Intrusive interstitials are frustrating for users as they block the content that they expect to see after clicking through to a result from Google search. With the inclusion of interstitials within the page experience update, it’s more important than ever for sites to audit the interstitials and banners used to assess content accessibility for users and search engines.
Auditing intrusive interstitials
It’s important to test Google’s rendered output of key page templates to make sure it’s able to access all of the key elements of the pages. Also, cookie banner designs need to be analysed to make sure they don’t take up too much of the viewport. The aim should be to make sure that the most important hero element of a page remains unobstructed by interstitials for users.
You can use the URL Inspection Tool in Google Search Console to check how Google is rendering pages and see if interstitials are hiding any content behind them.
To test interstitials on key page templates, just load up a few pages from each template and manually review them on different devices. For example, for an ecommerce site, this could be the homepage, two category pages, two product pages and two blog pages.
Alternatively, you could do a Screaming Frog list crawl on a small quantity of pages, enabling JavaScript rendering within the settings (make sure rendered page screenshots is ticked, too). Then just flick through the screenshots for the URLs (which can be found on the ‘rendered page’ tab at the bottom).
Don’t wait to optimise for INP!
Google cautions that “it takes time and effort to improve INP.” To make sure our clients are ready for the upcoming update next year, we’ve been running INP audits now to identify any problem areas that can be fixed ahead of time.
This accounts for long development queues which can often be a problem. The duration of your development lifecycle will dictate how early you will need to start these communications with your developers. Does it normally take six months or more between raising a development request and the fix being implemented? Then you’d better get started and get those tickets logged now!
While implementing these improvements should improve the signals of pages, optimising for core web vitals and page experience isn’t solely about keeping up with Google; it’s about nurturing our users and providing them with the best online experiences possible to build brand loyalty so that they keep coming back.
User experience should be factored into our day-to-day work as SEOs. Focusing on enhancing how users interact with your site is the way to go to future-proof your digital marketing strategies against search engine updates.
Thanks for getting this far and learning about web vitals and the introduction of INP. I hope you’ve enjoyed this guide! If you found this helpful, why not share this with your inner circle? Just click on the social icons below. If you’d like support with making sure your website is prepared for the fast-approaching Web Vitals update then get in touch, we’d love to help!