“My bounce rate is too high…”
Bounce rate is one of the most misunderstood metrics in Google Analytics. Most people think that a high bounce rate means users aren’t engaging with your site, but this isn’t always the case.
A ‘bounce’ is defined as a single-hit session; a user lands on your site and leaves without interacting with it. Each session times out after 30 minutes by default, but this can be manually adjusted from 1 minute to 4 hours.
This doesn’t necessarily mean that a low bounce rate is good. The optimum bounce rate depends on what your business is trying to measure. For instance, if you want users to get the information they need quickly, a high bounce rate indicates that they’ve entered the site on the page they were looking for, discovered what they need and left.
In the example below, this user has been extremely engaged with our blog; they’ve shared the post, followed our link, read the whole article and even left us a nice comment.


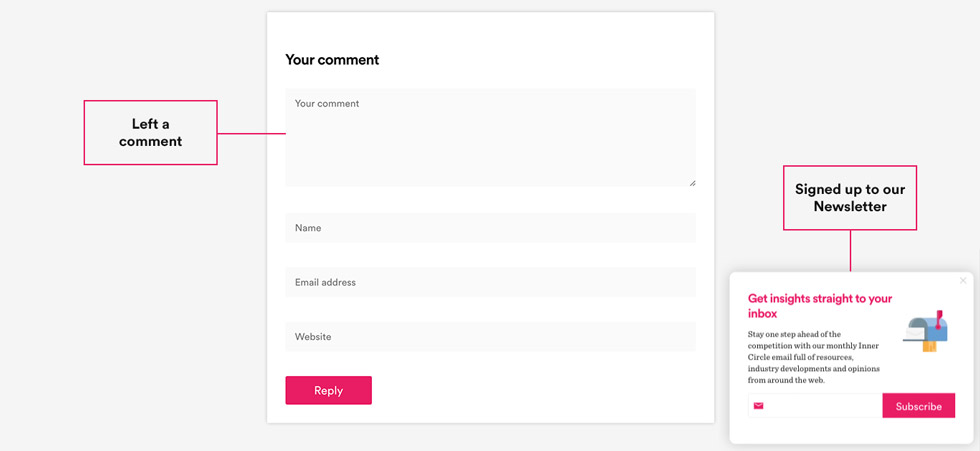
However, an out-of-the-box implementation would class this as a bounce.
If you’re trying to measure how well the content on that page is doing, Google Analytics won’t have tracked all those interactions as standard, so there’s no way of knowing.
In part two, we’ll run through how to track these interactions as engagement, and improve the accuracy of your bounce rate, but for now we’re just going to focus on getting a proper understanding of engagement metrics and what they mean.
“How long were users reading my article?”
When trying to understand how long users are spending reading your content, it’s customary to look at ‘Avg. time on Page’ in Google Analytics. You may decipher this metric as a measurement of how much time a user has spent on a particular page, but what is actually being measured is the time between hits received by Google Analytics.
Let’s say a user spends 17 minutes reading your blog post and then leaves the site with the information they were after. Unfortunately, by default, this time wouldn’t be accounted for in ‘Avg. Time on Page’ as exit pages are removed from the calculation.
Avg. Time on Page = Time on Page / ( Pageviews - Exits)
The higher the number of exits a page has, the lower the confidence is for the ‘Avg. Time on Page’ metric.
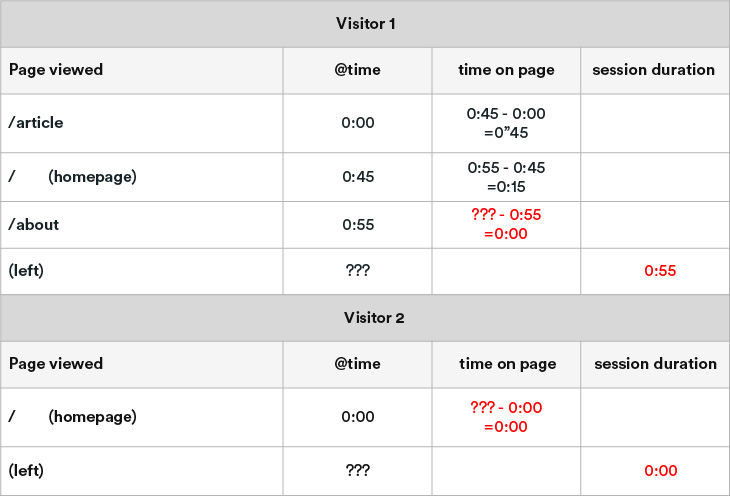
Another metric used to understand the time being spent on-site is ‘Avg. Session Duration’. Google Analytics calculates this based on the time stamp between the first and last hit received.
Avg Session Duration = Session Duration / Sessions
Similar to bounce rate, the session duration can be affected by interactive events. But unlike avg. time on page, it doesn’t remove exit pages from the calculation.
As you can see, the session duration should be over 6 minutes, but because there was no additional hit sent on the last page, the 2 minutes isn’t included in the session duration. If a user bounces from your site, the session duration will be set at 0. With all these flaws, session duration can be very inaccurate. Understanding and reporting on how users behave on your sites can come with lots of caveats.
“We need to increase our pages per session”
Often, I come across businesses setting KPIs around increasing pages per session, wanting to see their users engaging with more content. But, without a proper understanding of what this metric is measuring, this indicator isn’t always going to paint a positive picture.
Say a user visited eight pages during their session on our blog site and then left. Would you consider this a positive or negative interaction?
Well, consider that the user was looking for a specific piece of content. Perhaps they landed on your website, navigated to the blog section, couldn’t find the article they were looking for, tried to use the internal search, but didn’t know the name of the article, went back to the blog section and went through recent blog posts and gave up. Google Analytics records both navigation pages and articles within this session, so while the page views could be high, the actual article views could be low. By default, the data doesn’t break this down.
Looking at common content metrics alone often doesn’t give you enough of an insight into content performance to make informed business decisions. By recognising the limitations of default data, investigating further and adding custom implementations, you’ll be able to improve your insight into content performance.
Stay tuned for the next article, where we’ll delve into how to use these metrics more effectively and how to sidestep the problems inherent in their default implementations. In the meantime, why not check out our webinar on the topic.