Option 1: Geolocation APIs
What if I told you that you could bring back the ‘Service Provider’ dimension in its entirety to your setup? It sounds too good to be true, but it is possible (with a small catch, but we’ll get to that in a bit). This notion is achievable using a geolocation Application Programming Interface (API) to provide similar data to ‘Service Provider’. Just in case you may be unfamiliar with this, an API is essentially a set of functions that allow you to talk to a server for it to send you the data you’re looking for.
Now you may be asking, how do Geolocation APIs fit into this precisely, and how do I use it? Well many of them offer one particular data point that is of interest to us: the user’s Internet Service Provider (ISP). And yes, it’s basically the same thing.
To get geolocation data into your Google Analytics setup:
- A request is made within the browser (while the user is on the site) to the geolocation data provider, which will send a response, if the request was successful.
- Then the data within the provider’s response can be pushed into the data layer, for use in both Google Tag Manager and Google Analytics. Simo Ahava has conveniently created a custom tag to take care of this, but there are options available for a more hands-on approach.
Once you’ve imported the ISP data into your Tag Management System using data layer variables, you can then configure the Google Analytics tags to use it as a custom dimension. When configuring the dimension on Google Analytics’ side, I’d recommend setting this up as at the ‘session’ level. Many geolocation APIs can even provide multiple data points on top of the ISP that can potentially be used to help give you more insights from your reports.
But I say this with a warning: be sure to double-check the information you’re importing doesn’t expose any personally identifiable information (PII), or your Google Analytics account could be terminated, so approach this with caution.
Another point to consider when pursuing this option is the amount of traffic your site receives daily. Depending on what you use, API pulls can be capped with a daily limit, and each hit sent to Google Analytics that pulls Geolocation data adds to that limit. If your site receives a high amount of traffic and you make one too many pulls, the API will start rejecting requests and stop sending Geolocation data, leaving gaps within your reports. Some APIs do have paid subscription options that allow unlimited pulls, but you’ll need to look into this and decide if that’s the right course for you.
Option 2: Using Dimensions from Google Analytics
The more grassroots option of the two, as it’s based on data already implemented into your Google Analytics setup. This option focuses on a two-step process:
1. Analysing your reports to find patterns that correlate with bot traffic
For this step, you want to look through as much data as you can (before sampling kicks in) to help give a decent picture of how much bot traffic affects your data. I’d recommend focusing your investigation on the dimensions and metrics found within the ‘Audience’ reports. For metrics, users, sessions, and bounce rate are the ones I look at first. Bots have a very short attention span, so they’ll usually be active on only one page, after which they’ll leave the site. Because of this, Google Analytics will track them as having an equal number of users, new users and sessions, as well as very high bounce rates, and this is typically a giveaway.
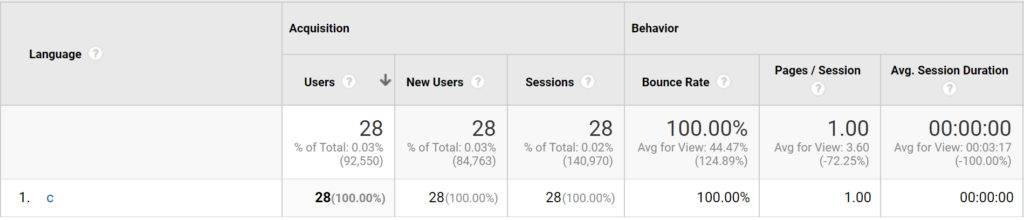
One example: in the past whilst looking at the language dimension, we came across the unique value ‘c’ and considering that language values should have at least two characters, this was a hint that the traffic wasn’t legitimate. And lo and behold, there were an equal amount of users, new users and sessions and an alarmingly high bounce rate.
To help kickstart your enquiry, I’ve found the browser and language dimensions to be good starting points for noticing bot traffic behaviour from past investigations. But remember, the aim is to find unique values that sync up with bot traffic behaviour, so if you don’t see any correlations with these looking into other dimensions may yield better results.
You may also find adding secondary filters to reports or creating custom reports may help provide a more in-depth cross-section of dimensions affected by bot traffic. Be aware of running into sampling issues if you do this, as these generate ad-hoc queries.
2. Crafting a solution that focuses on your findings
Once you’ve recognised any skewed dimensions and metrics, attributed to bot traffic, it’s time to implement measures to exclude them from your reports. In particular, filters that home in on these patterns are what we’ll be focusing on.
Depending on how granular your findings are from the previous step, your approach to this can differ. If you can attribute any issues found to a particular dimension value, all it takes is a simple exclusion filter. But if you found a more specific cross-section of values from multiple dimensions, a combination of advanced and exclusion filters is the way to go.
Suppose you found values within three dimensions that exhibit bot traffic behaviours, you can combine the values of two of those dimensions into a custom field using an advanced filter. Then create another in which you connect the custom field value with the third dimension’s value and output this into a custom dimension. Finally, implement an exclusion filter based on the output of the custom dimension.
Which option is best for you?
If you’re essentially looking to bring back the service provider dimension, and can expense a subscription fee, I’d lean towards the geolocation API route, as this can be quickly set up to start sending data.
While you can find APIs that allow requests free of charge, there may be a cap on how many you can do so be mindful of that to avoid any loss of geolocation data. Bear in mind you may also need to fit in research time to craft your bot filter using this data.
If you don’t want to deal with monthly fees, you can go straight into crafting a solution using your already established dimensions within Google Analytics. Generally, this is my preferred option between the two, especially with advanced filters, as it allows for a high degree of specificity in terms of the values you’re using for the filter, and implementing them has taught me much about bot traffic patterns and behaviours. But be prepared to make regular check-ups on the filter’s functionality, as bot traffic is never consistent.
Ultimately, there’s no right or wrong here, whichever you choose you’ll have a richer data set and be filtering out bots in no time. As always, if you have any questions on the above, feel free to get in touch with us on the Data team!