Segmentation
Segments allow you to group sessions or users based on specific behaviours performed. Segments enhance your ability to find insightful data on your users’ journeys when applied to reports, especially the ones I will be discussing with you today. Aside from enhancing your reports, you can also use segments themselves to analyse user journeys – we can break this down into two main functions.
The first function is to group sessions based on a specific interaction. For instance, I could create a segment for sessions that had signed up to our newsletter. Utilising the ‘All Pages’ report, I can see the exact pages users visited during converting visits. Additionally, if I had content groupings set up, I’d be able to quickly identify the types of content read before my users went on to sign-up to my newsletter. This information can be passed to the content team to prioritise the creation of articles that are likely to assist us with driving more newsletter sign-ups.
The second function is to create a segment with the sequencing rules, essentially allowing you to build a custom funnel without the ability to see drop off along the steps. One of the ways to utilise this feature is to create an open funnel with the first and last step. This way, using the ‘All Pages’ Report, you can exclude those two steps and analyse the pages viewed between these steps.
Behaviour Flow
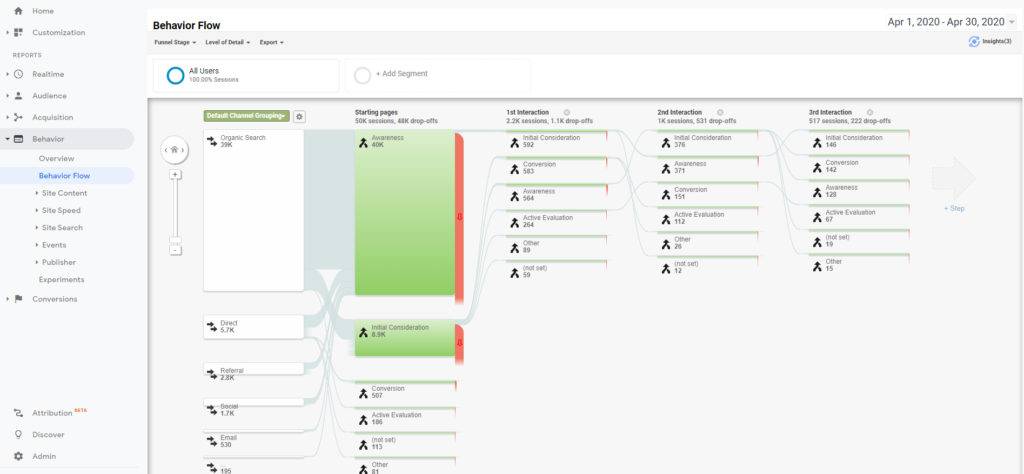
Behaviour flow visualises the paths that users most-frequently take on your website with the ability to change the granularity to gain insights into the behaviours that are important to you. You can find out which pages users are frequently navigating between or if users are diverting journeys.
User Explorer
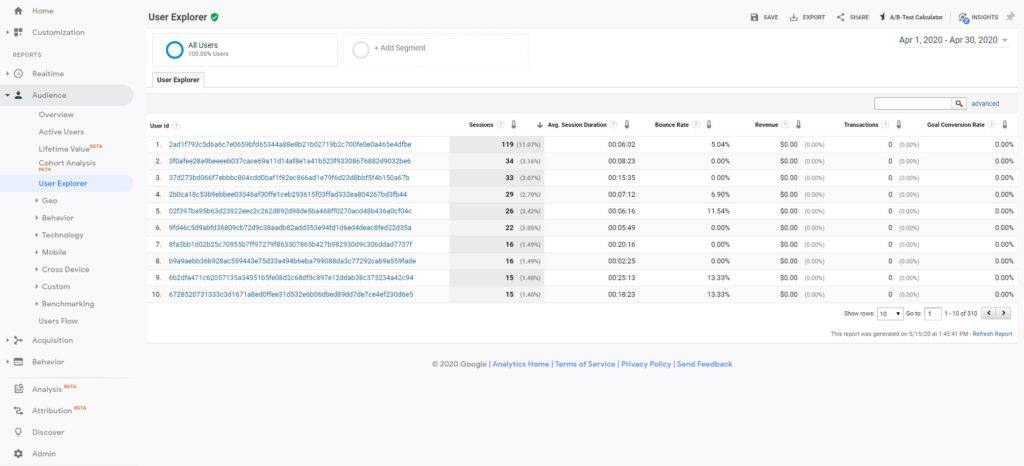
If you’re interested in looking at a specific user’s journey, User Explorer is the report for you. To use this feature, you’re first required to enable the User-ID feature in your property settings if you have not done so already. Once set up, you can find this report in Audience > User Explorer.
The User Explorer report stitches together the pages and events an individual user has performed on your site, displaying them as a timeline that can be analysed.
This can be harder for larger sites, due to the volume of users; however, using segments, you can filter down the list to find individuals that have done specific actions on your site. For instance, you can segment users who have completed very particular activities to discover if there’s any commonalities between similar users.
Previous Page Path
The Previous Page Path dimension is an excellent tool for analysing journeys. The primary purpose of using the Previous Page Path is for looking at how users are navigating to a specific page. This is handy for pages with multiple entrance points to a page like “Contact Us”, allowing you to analyse which pages are driving people to contact you.
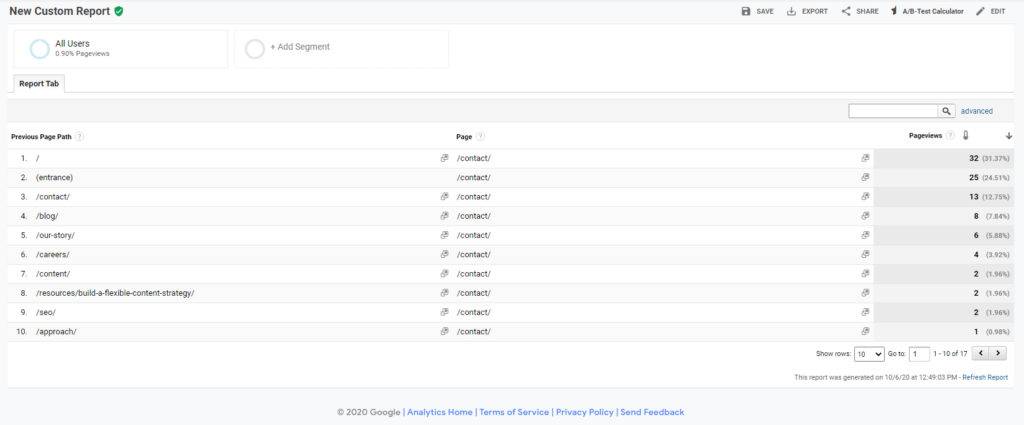
This will highlight irrelevant pages and will assist you to find pages where users are struggling to find the information they are after.
Checkout Behaviour/Shopping Behaviour
Checkout Behaviour/Shopping Behaviour are both available once you have set up enhanced ecommerce tracking on your website. Due to this, it’s one of the key ways to analyse ecommerce journeys in Google Analytics. You can find this report in Conversions > Ecommerce > Shopping Behaviour/Checkout Behaviour.
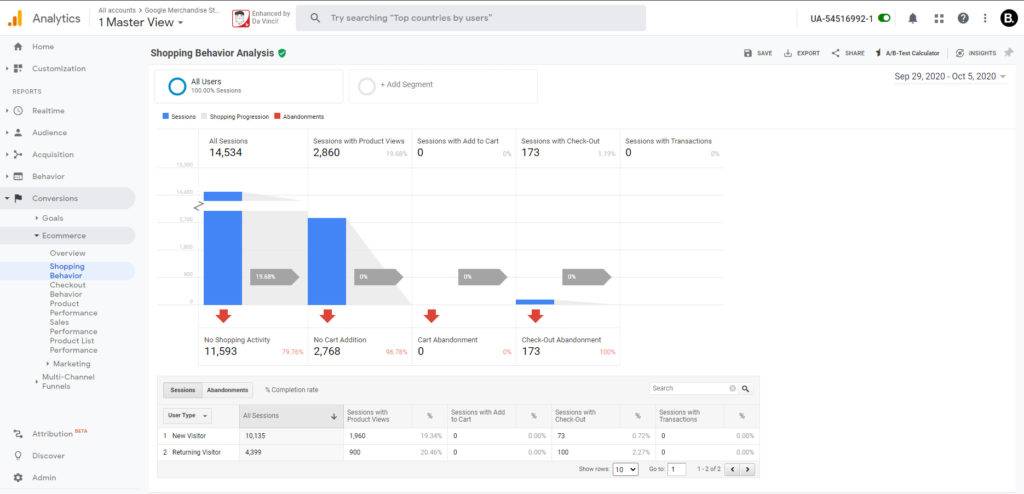
Shopping behaviour is a quick way to understand the health of your ecommerce journey. It provides a snapshot of your users’ shopping experience and gives you a breakdown of the percentage of users that have gone from viewing a product, all the way to purchasing a product on your website. You can build segments from any of the steps to help you analyse users in that funnel or even create segments from the drop-offs to understand why those users haven’t moved on to subsequent steps.
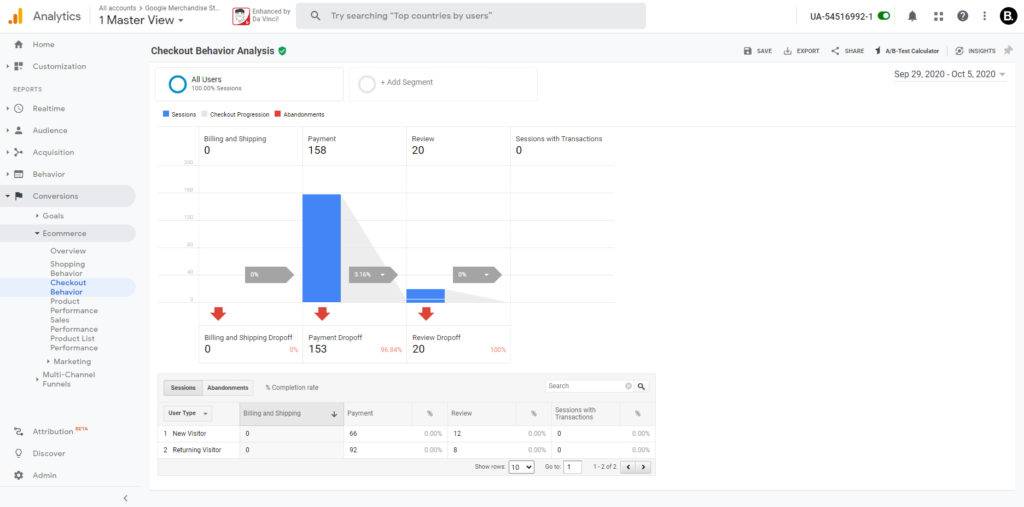
Checkout Behaviour focuses specifically on the checkout journey itself, highlighting any potential issues your users might be having once they’ve committed to purchasing a product from you by showing at which page they drop off at.
Site Search
Site Search is a custom feature of Google Analytics and uses query parameters to map internal search terms and categories. It must be enabled first which you can do in the view settings.
Though it isn’t a traditional way to analyse user journeys, it helps to analyse which terms users are searching internally. This can help you find gaps in content by looking at the keywords with low clickthrough rate, suggesting there wasn’t any content that the user wanted to read.
You can also use it to discover content that users are struggling to find whilst navigating your site. You can deep dive these by grouping users that have searched a specific term in a segment and analysing which pages they visited.
Custom Funnels
Custom funnels let you build a user journey and monitor the drop-off between steps. There are several ways you can build these in Google Analytics. As mentioned above, you can use a segment utilising the sequence feature. While this won’t allow you to monitor drop-off from your funnel, this feature can be used via the Google Analytics Reporting API and in Google Data Studio, unlike the options below. If you’re fortunate enough to have Google Analytics 360 within your organisation, then building custom funnels and analysing drop-off is easier.
Custom Reports – Funnel Report Type
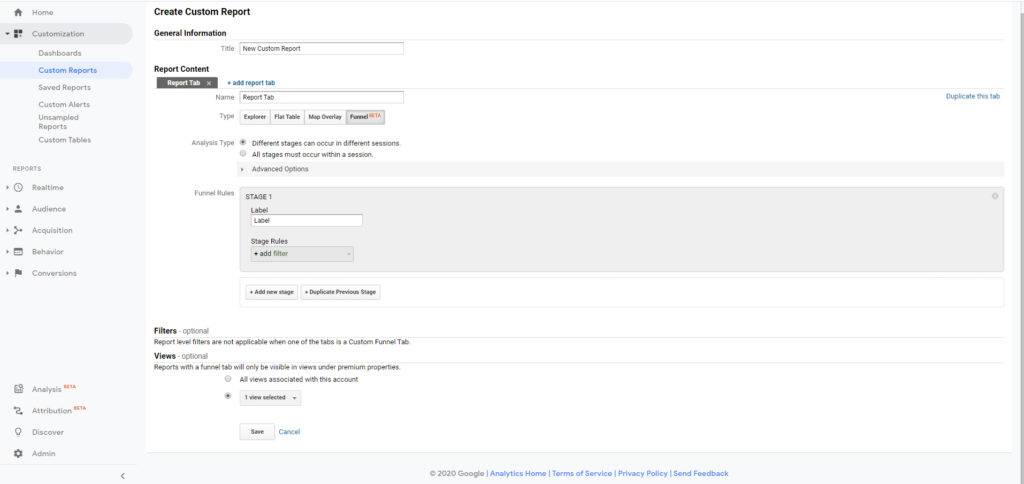
Custom Funnels are one of the easiest ways to map and analyse specific user journeys within Google Analytics. This feature allows you to visualise the journey a user takes to complete an action on your site. Unlike the Behaviour Flow feature, you have to set up the journey you would like to analyse.
This feature is fully customisable, allowing you to choose whether the user must perform the actions during the same session or across multiple sessions. You can also choose if the funnel is open or closed, meaning users must perform each subsequent step or they can join further along. Furthermore, there’s the option to decide if you would like users to be able to divert between steps, or whether each step must be followed by the next.
You can even build segments based on users who have dropped off at certain points in the funnel, which helps to spot trends that have caused users to divert from their journey.
There are limitations to this feature; you can only have up to five stages in each custom funnel and each of these steps is limited to five rules.
Advanced Analysis
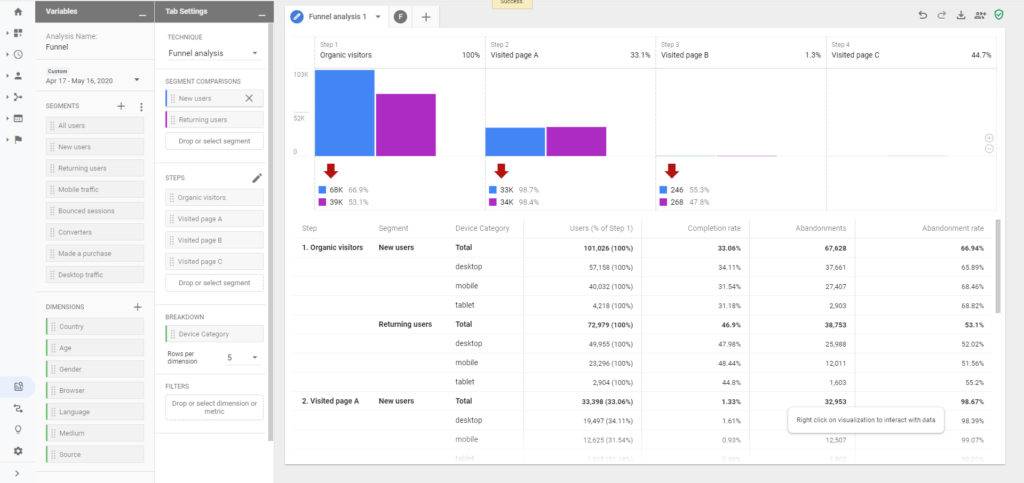
Advanced Analysis is another 360-exclusive feature. It was released in May 2018 and, at the time of writing this post, is still in beta. It’s Google’s answer to the workspaces available in Adobe Analytics, allowing a user to build fully customised reporting for a quick and easy way to delve into the data and derive insights.
Advanced Analysis has a few different report types. The one we’re focusing on for analysing user journeys is ‘Funnel Analysis’. It’s very similar to Custom Funnels with additional features that make this an incredibly powerful feature – one being that you can choose to analyse up to 10 steps rather than five. But the real advantage is the ability to use segments and dimensions to further breakdown your funnel.
When choosing between Custom Funnels and Advanced Analysis, it all depends on how in-depth you want to go with the analysis. Custom Funnels are fantastic as a start, but if you want to really analyse the user types that are dropping off, Advanced Analysis is the tool for you.
There are tons of features in Google Analytics and even more ways of using them to analyse your users. By understanding the limitations and features of them you’ll be able to use the right one to gather the insights you want to drive. User journeys can be complex, but by using the features above you’ll be able to improve user experience on your site and drive increased revenue for your business.
If you have any questions about this post, or want to talk more about user journeys, please leave a comment below and I’ll get back to you.
Alqalam
Very good analysis.
Kabza De Small
Thanks so much